
Texas Instruments stock climbs 3.42% as sellers lose traction after multi-day slide

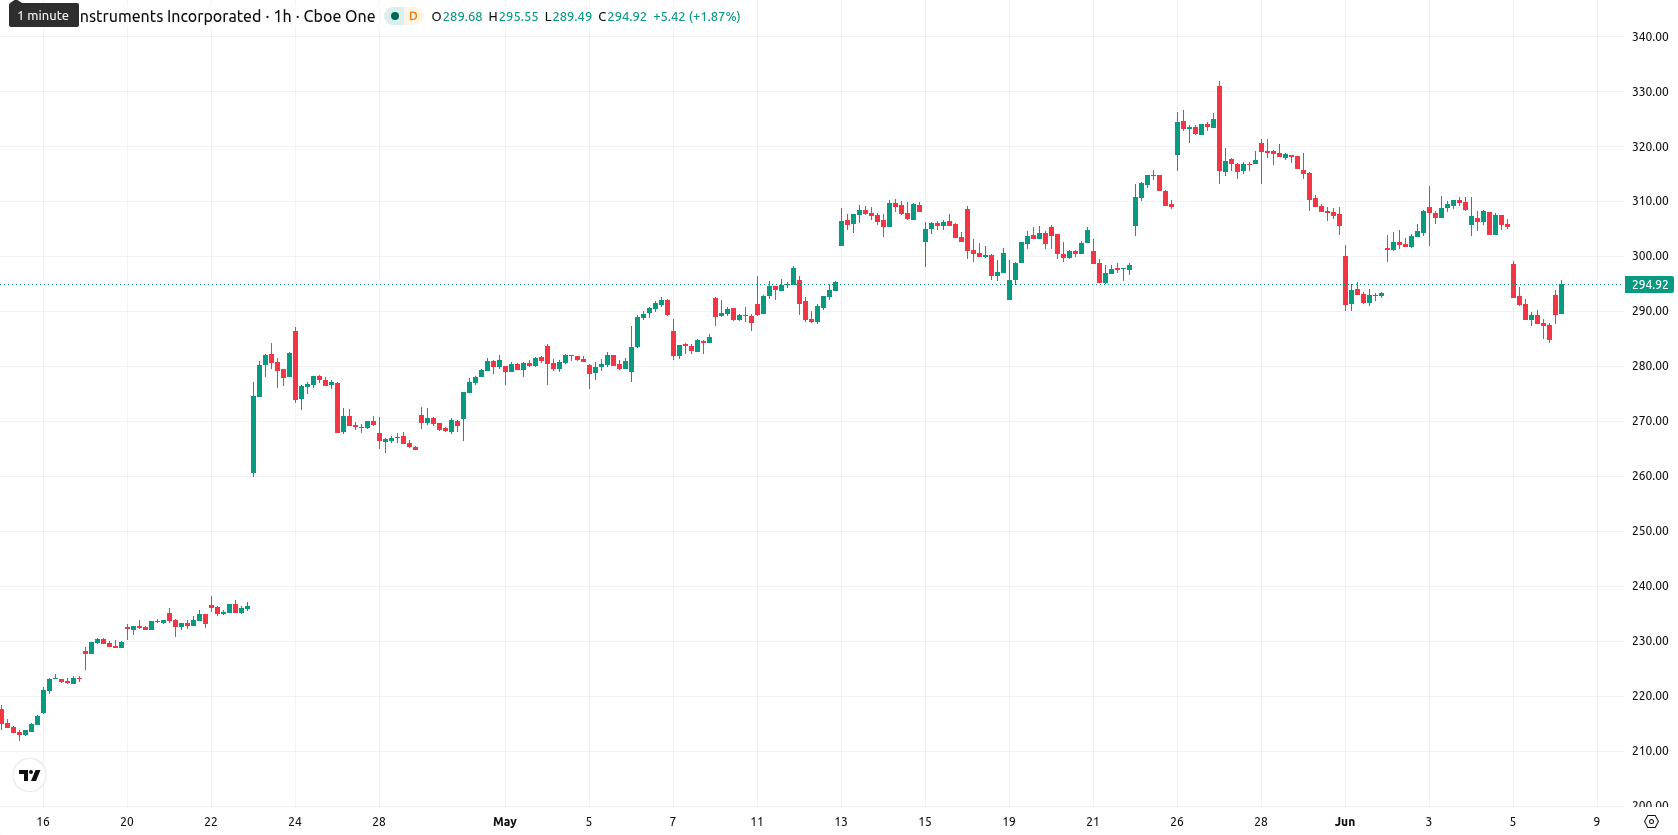
Texas Instruments Incorporated (TXN) stock is trading at $295.11 after a daily rise of 3.42%, with price movement sitting below short- and medium-term averages but remaining above longer-term averages.
Highlights
- TXN/USD faces short- and medium-term selling pressure, trading below key moving averages despite a recent intraday advance.
- Momentum signals are predominantly bearish with oversold short-term oscillators, though long-term trend remains broadly bullish.
- Expected trading range is $282.65 to $307.57 over the next 2–3 days, with 60% probability of downside continuation.
Bearish momentum reinforced as major averages and signals diverge
On the hourly chart, TXN is trading below the MA-20 at $299.29 and MA-50 at $303.10, while remaining above the MA-200 at $205.94. The Ichimoku Kijun indicator on the D1 timeframe stands at $298.83 and serves as immediate resistance. Momentum indicators show persistent selling: RSI is at 39.53; MACD, ADX, and CCI support a bearish short-term outlook. The Stoch RSI is neutral, BBP registers as oversold to highlight seller strength, and the Awesome Oscillator is neutral, signaling a divergence between indicator signals and recent price direction.
Sideways bias as bearish risk outweighs reversal odds
For the next 2–3 trading days, TXN is expected to move within the $282.65 to $307.57 range, reflecting a typical volatility band for the period. The probability of an upward move is assessed at 40%, with a higher 60% chance of a further decline. Price action is baseline expected to remain sideways until a decisive move—either a close above $298.83 for a bullish breakout or a break below $282.65 as a trigger for downside momentum—occurs.
Earlier, analysts noted that Texas Instruments had shifted from a bullish to a more cautious technical stance, highlighting rising downside risk amid intensified selling signals. The current outlook reinforces this defensive bias, with persistent bearish momentum and diverging indicators suggesting traders should closely monitor for a decisive break above $298.83 or below $282.65 to signal the next directional move.


Latest Texas Instruments News


-
 Afghanistan
-
 Albania
-
 Algeria
-
 Angola
-
 Argentina
-
 Armenia
-
 Australia
-
 Austria
-
 Azerbaijan
-
 Bahamas
-
 Bahrain
-
 Bangladesh
-
 Belarus
-
 Belgium
-
 Bolivia
-
 Botswana
-
 Brazil
-
 Brunei
-
 Bulgaria
-
 Cambodia
-
 Cameroon
-
 Canada
-
 Chile
Chile
-
 China
China
-
 Colombia
-
 Congo
Congo
-
 Costa Rica
-
 Cote d'Ivoire
-
 Croatia
-
 Cuba
Cuba
-
 Cyprus
-
 Czechia
-
 DR Congo
-
 Denmark
-
 Dominican Republic
-
 Ecuador
-
 Egypt
Egypt
-
 El Salvador
-
 Estonia
-
 Eswatini
-
 Ethiopia
-
 Finland
-
 France
-
 Georgia
-
 Germany
-
 Ghana
Ghana
-
 Greece
-
 Haiti
Haiti
-
 Hong Kong
-
 Hungary
-
 India
India
-
 Indonesia
-
 Iran, Islamic republic
-
 Iraq
Iraq
-
 Ireland
-
 Israel
-
 Italy
Italy
-
 Jamaica
-
 Japan
Japan
-
 Jordan
-
 Kazakhstan
-
 Kenya
Kenya
-
 Korea
Korea
-
 Kuwait
-
 Kyrgyzstan
-
 Laos
Laos
-
 Latvia
-
 Lebanon
-
 Lesotho
-
 Libya
Libya
-
 Lithuania
-
 Luxembourg
-
 Madagascar
-
 Malaysia
-
 Malta
Malta
-
 Mauritius
-
 Mexico
-
 Moldova
-
 Mongolia
-
 Montenegro
-
 Morocco
-
 Mozambique
-
 Myanmar
-
 Namibia
-
 Nepal
Nepal
-
 Netherlands
-
 New Zealand
-
 Nigeria
-
 North Macedonia
-
 Norway
-
 Oman
Oman
-
 Pakistan
-
 Palestine
-
 Panama
-
 Papua New Guinea
-
 Paraguay
-
 Peru
Peru
-
 Philippines
-
 Poland
-
 Portugal
-
 Puerto Rico
-
 Qatar
Qatar
-
 Reunion
-
 Romania
-
 Rwanda
-
 Saudi Arabia
-
 Serbia
-
 Singapore
-
 Slovakia
-
 Slovenia
-
 Somalia
-
 South Africa
-
 Spain
Spain
-
 Sri Lanka
-
 Sweden
-
 Switzerland
-
 Syria
Syria
-
 Taiwan
-
 Tajikistan
-
 Tanzania
-
 Thailand
-
 Trinidad and Tobago
-
 Tunisia
-
 Turkey
-
 UAE
UAE
-
 Uganda
-
 Ukraine
-
 United Kingdom
-
United States
-
 Uruguay
-
 Uzbekistan
-
 Venezuela
-
 Vietnam
-
 Yemen
Yemen
-
 Zambia
-
 Zimbabwe
- Forex
- Crypto
