
+5.43% for Marathon Digital stock as buying pushes price through resistance zone

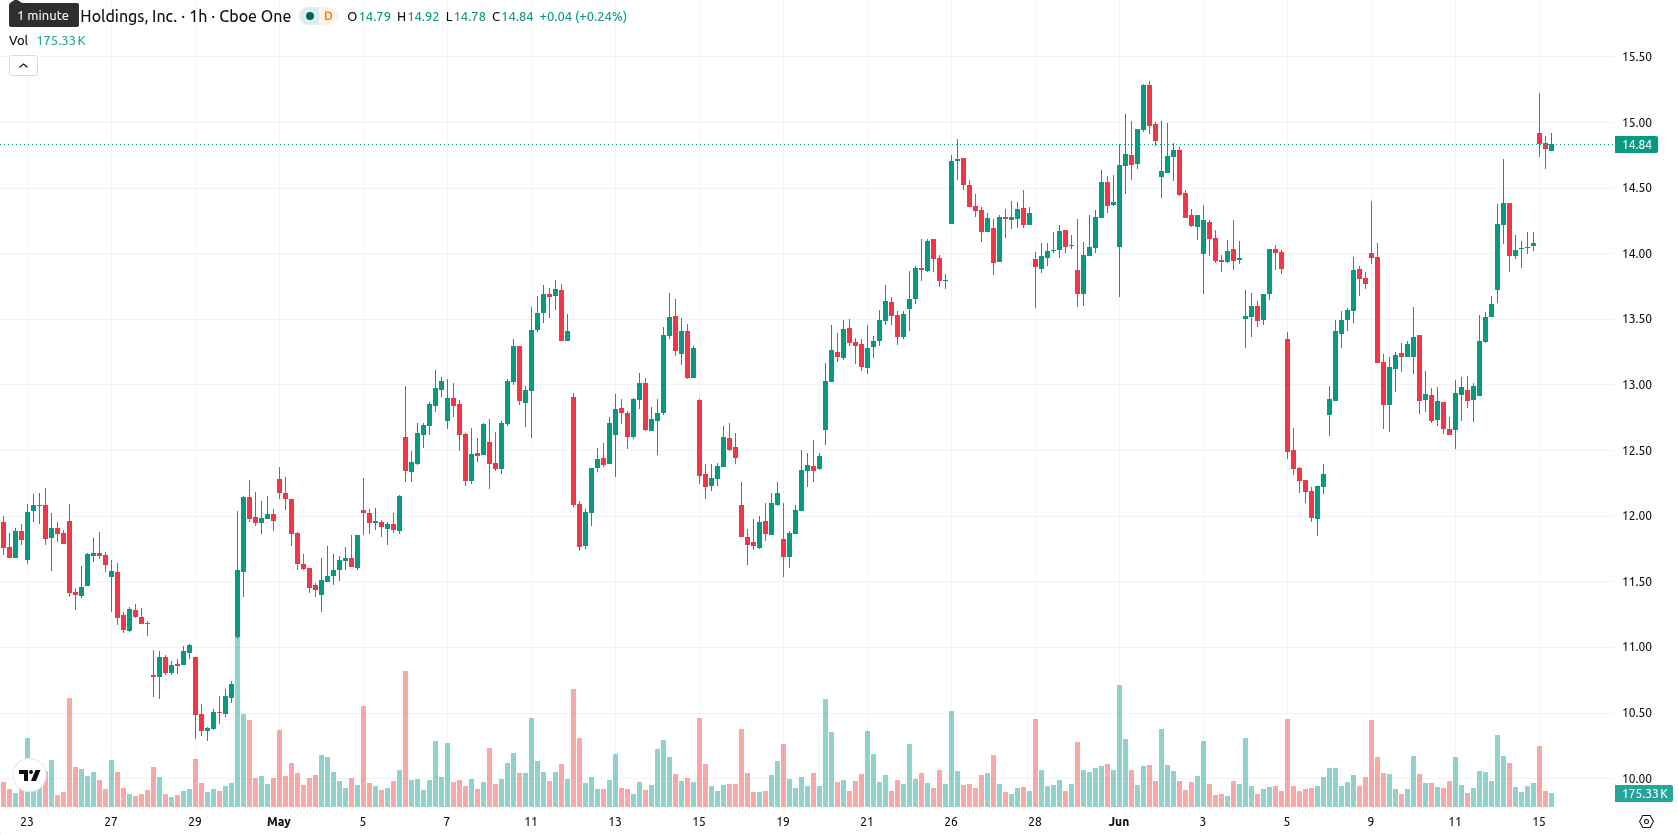
Marathon Digital Holdings, Inc. (MARA) stock is trading at $14.85, marking an increase of 5.43% on the day. The price currently sits above its key moving averages.
Highlights
- MARA/USD maintains a strong bullish bias, trading above key moving averages across all timeframes.
- Momentum indicators remain firmly bullish but show overbought conditions, signaling potential for a near-term pullback.
- Expected trading range is $13.86–$15.84 in the coming days, with higher probability of an upside breakout.
Overbought signals persist as technical boundaries tighten
On the hourly chart, MARA is trading above the MA-20 ($13.58) and MA-50 ($13.34); on the daily chart, it is also above the long-term MA-200 ($12.57). The Ichimoku Kijun at $13.84 provides immediate support. The projected near-term trading range is $13.86–$15.84, with $13.86 acting as support and $15.84 marking resistance. Momentum indicators show RSI at 71.37, MACD on a Buy signal, ADX on Buy, Awesome Oscillator on Buy, and intraday conditions confirmed overbought by both Stoch RSI and CCI, as well as strong buyer dominance signaled by BBP.
Sideways consolidation likely as volatility narrows in near term
For the short term, MARA is expected to trade within a typical volatility band of $13.86 to $15.84 over the coming days. The most likely scenario is for the stock to consolidate sideways within this corridor. Should bullish momentum persist, MARA could push above the $15.84 resistance area. Alternatively, a pullback below $13.86 support may develop if profit-taking accelerates.
Earlier, analysts noted that Marathon Digital’s technical profile and strengthening momentum pointed to a positive medium-term outlook. The current setup, now coupled with overbought intraday signals and firmly established volatility boundaries, suggests traders should monitor for either a confirmed breakout or a potential profit-taking pullback as near-term positioning shifts.


-
 Afghanistan
-
 Albania
-
 Algeria
-
 Angola
-
 Argentina
-
 Armenia
-
 Australia
-
 Austria
-
 Azerbaijan
-
 Bahamas
-
 Bahrain
-
 Bangladesh
-
 Belarus
-
 Belgium
-
 Bolivia
-
 Botswana
-
 Brazil
-
 Brunei
-
 Bulgaria
-
 Cambodia
-
 Cameroon
-
 Canada
-
 Chile
Chile
-
 China
China
-
 Colombia
-
 Congo
Congo
-
 Costa Rica
-
 Cote d'Ivoire
-
 Croatia
-
 Cuba
Cuba
-
 Cyprus
-
 Czechia
-
 DR Congo
-
 Denmark
-
 Dominican Republic
-
 Ecuador
-
 Egypt
Egypt
-
 El Salvador
-
 Estonia
-
 Eswatini
-
 Ethiopia
-
 Finland
-
 France
-
 Georgia
-
 Germany
-
 Ghana
Ghana
-
 Greece
-
 Haiti
Haiti
-
 Hong Kong
-
 Hungary
-
 India
India
-
 Indonesia
-
 Iran, Islamic republic
-
 Iraq
Iraq
-
 Ireland
-
 Israel
-
 Italy
Italy
-
 Jamaica
-
 Japan
Japan
-
 Jordan
-
 Kazakhstan
-
 Kenya
Kenya
-
 Korea
Korea
-
 Kuwait
-
 Kyrgyzstan
-
 Laos
Laos
-
 Latvia
-
 Lebanon
-
 Lesotho
-
 Libya
Libya
-
 Lithuania
-
 Luxembourg
-
 Madagascar
-
 Malaysia
-
 Malta
Malta
-
 Mauritius
-
 Mexico
-
 Moldova
-
 Mongolia
-
 Montenegro
-
 Morocco
-
 Mozambique
-
 Myanmar
-
 Namibia
-
 Nepal
Nepal
-
 Netherlands
-
 New Zealand
-
 Nigeria
-
 North Macedonia
-
 Norway
-
 Oman
Oman
-
 Pakistan
-
 Palestine
-
 Panama
-
 Papua New Guinea
-
 Paraguay
-
 Peru
Peru
-
 Philippines
-
 Poland
-
 Portugal
-
 Puerto Rico
-
 Qatar
Qatar
-
 Reunion
-
 Romania
-
 Rwanda
-
 Saudi Arabia
-
 Serbia
-
 Singapore
-
 Slovakia
-
 Slovenia
-
 Somalia
-
 South Africa
-
 Spain
Spain
-
 Sri Lanka
-
 Sweden
-
 Switzerland
-
 Syria
Syria
-
 Taiwan
-
 Tajikistan
-
 Tanzania
-
 Thailand
-
 Trinidad and Tobago
-
 Tunisia
-
 Turkey
-
 UAE
UAE
-
 Uganda
-
 Ukraine
-
 United Kingdom
-
United States
-
 Uruguay
-
 Uzbekistan
-
 Venezuela
-
 Vietnam
-
 Yemen
Yemen
-
 Zambia
-
 Zimbabwe
- Forex
- Crypto
