
Oversold signals limit further losses for Rivian stock with price under pressure

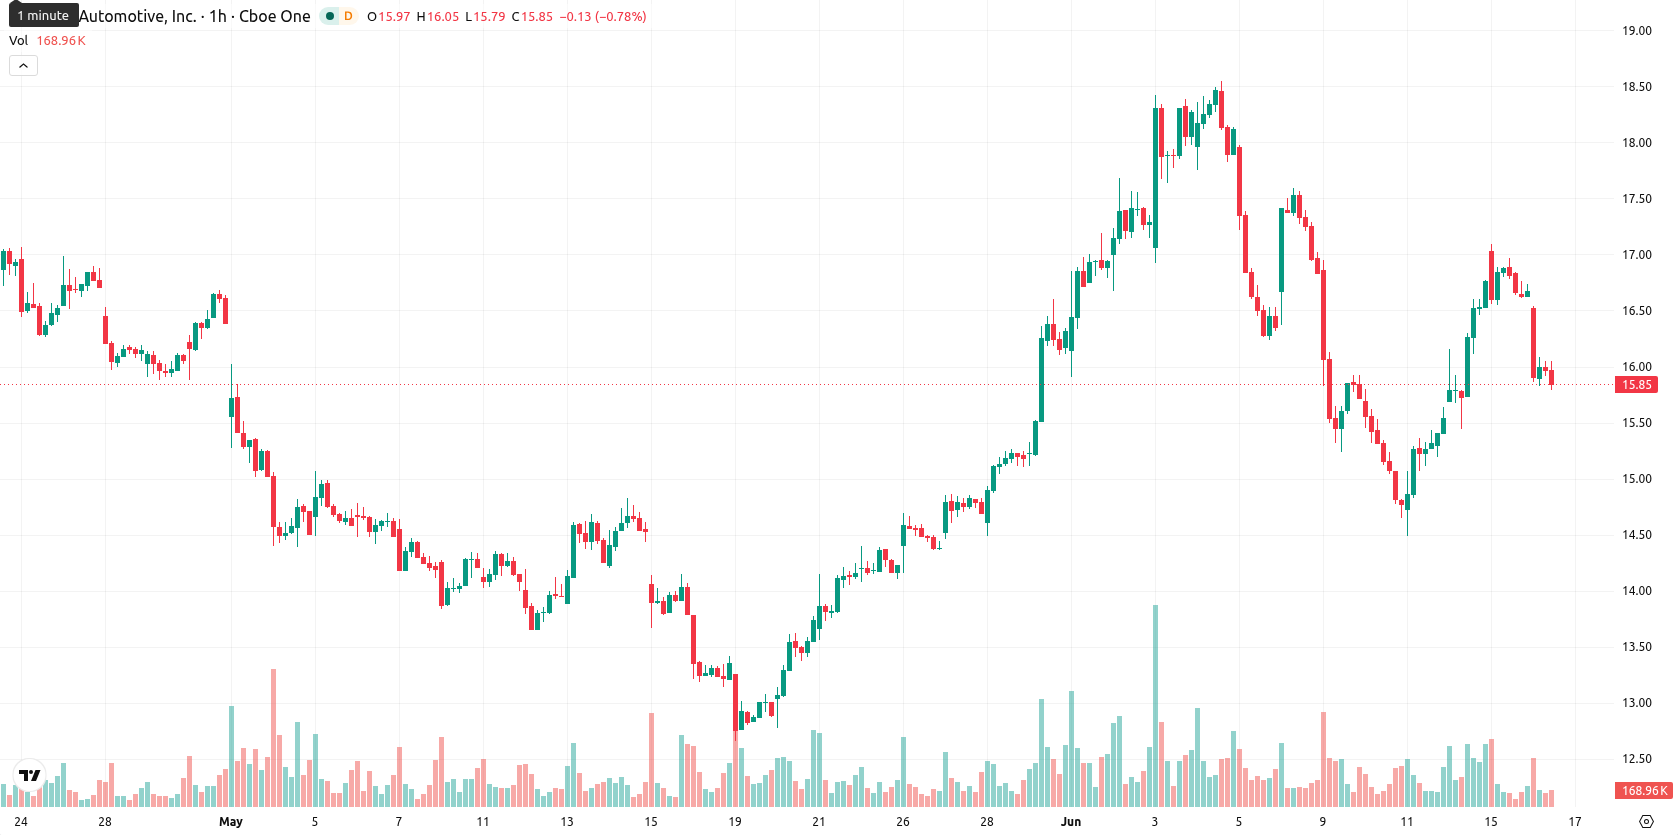
Rivian Automotive Inc. (RIVN) stock is trading at $15.97 after falling 4.09% on the day. The share price is positioned below its key moving averages, indicating continued near-term weakness.
Highlights
- Rivian initiated deliveries of its lower-cost R2 SUV, signaling operational ramp-up and product portfolio expansion.
- The company partnered with ChargeScape for broader home EV charging access and revealed advanced driver-assistance system plans for upcoming models.
- RIVN faces short- and medium-term selling pressure, with the expected price range of $14.84 to $17.10 and a higher probability of downside continuation.
Operational expansion and partnerships as shares remain under pressure
Rivian has begun public deliveries of its lower-priced R2 mid-size SUV from its Normal, Illinois plant, marking a tangible expansion in its product lineup and operational output. The company has also formed a partnership with ChargeScape to allow Rivian EV owners across North America access to utility-managed home charging programs, giving drivers the ability to reduce charging costs and contribute to electricity demand management. Additionally, Rivian has announced plans to release an advanced driver-assistance system similar to Tesla's Full Self-Driving for its next-generation models later this year, with further autonomous capabilities expected in 2027, according to CEO RJ Scaringe. While these developments reflect operational progress, price action has remained under broader selling pressure.
Mixed momentum amid seller dominance and key technical boundaries
On the technical front, RIVN is trading below the MA-20 ($16.24) and MA-50 ($16.09) on the H1 chart, while remaining above the long-term MA-200 ($15.66). The immediate support is defined by the Ichimoku Kijun at $15.79. Momentum signals are mixed: MACD indicates a strong buy, but ADX points to a sell, highlighting market indecisiveness. The RSI is at 45.6 and the Stoch RSI remains in oversold territory, signaling possible short-term exhaustion to the downside. CCI is neutral, while BBP continues to signal seller dominance within the session, consistent with high volatility and a sharp intraday decline.
Downside risk prevails as breakout levels define near-term path
Over the next two to three trading days, the anticipated trading range for RIVN falls between $14.84 and $17.10, based on typical volatility bands relative to current levels. The probability of an upward move is estimated at 25%, with a higher 75% likelihood of further downside. Baseline expectations point to sideways price movement within this corridor, while a breakout above resistance would be required for a bullish reversal scenario. A breakdown through immediate support at $15.79 would open the way for a test of the lower end of the projected range.
Earlier, analysts noted that while Rivian's product launches and partnerships were supporting long-term prospects, near-term trading conditions remained mixed and called for investor caution. The latest market developments reinforce this cautious stance, with technical signals highlighting continued volatility and making the $15.79 support level the key threshold for traders watching for potential downside risk.


Latest Rivian Automotive News


-
 Afghanistan
-
 Albania
-
 Algeria
-
 Angola
-
 Argentina
-
 Armenia
-
 Australia
-
 Austria
-
 Azerbaijan
-
 Bahamas
-
 Bahrain
-
 Bangladesh
-
 Belarus
-
 Belgium
-
 Bolivia
-
 Botswana
-
 Brazil
-
 Brunei
-
 Bulgaria
-
 Cambodia
-
 Cameroon
-
 Canada
-
 Chile
Chile
-
 China
China
-
 Colombia
-
 Congo
Congo
-
 Costa Rica
-
 Cote d'Ivoire
-
 Croatia
-
 Cuba
Cuba
-
 Cyprus
-
 Czechia
-
 DR Congo
-
 Denmark
-
 Dominican Republic
-
 Ecuador
-
 Egypt
Egypt
-
 El Salvador
-
 Estonia
-
 Eswatini
-
 Ethiopia
-
 Finland
-
 France
-
 Georgia
-
 Germany
-
 Ghana
Ghana
-
 Greece
-
 Haiti
Haiti
-
 Hong Kong
-
 Hungary
-
 India
India
-
 Indonesia
-
 Iran, Islamic republic
-
 Iraq
Iraq
-
 Ireland
-
 Israel
-
 Italy
Italy
-
 Jamaica
-
 Japan
Japan
-
 Jordan
-
 Kazakhstan
-
 Kenya
Kenya
-
 Korea
Korea
-
 Kuwait
-
 Kyrgyzstan
-
 Laos
Laos
-
 Latvia
-
 Lebanon
-
 Lesotho
-
 Libya
Libya
-
 Lithuania
-
 Luxembourg
-
 Madagascar
-
 Malaysia
-
 Malta
Malta
-
 Mauritius
-
 Mexico
-
 Moldova
-
 Mongolia
-
 Montenegro
-
 Morocco
-
 Mozambique
-
 Myanmar
-
 Namibia
-
 Nepal
Nepal
-
 Netherlands
-
 New Zealand
-
 Nigeria
-
 North Macedonia
-
 Norway
-
 Oman
Oman
-
 Pakistan
-
 Palestine
-
 Panama
-
 Papua New Guinea
-
 Paraguay
-
 Peru
Peru
-
 Philippines
-
 Poland
-
 Portugal
-
 Puerto Rico
-
 Qatar
Qatar
-
 Reunion
-
 Romania
-
 Rwanda
-
 Saudi Arabia
-
 Serbia
-
 Singapore
-
 Slovakia
-
 Slovenia
-
 Somalia
-
 South Africa
-
 Spain
Spain
-
 Sri Lanka
-
 Sweden
-
 Switzerland
-
 Syria
Syria
-
 Taiwan
-
 Tajikistan
-
 Tanzania
-
 Thailand
-
 Trinidad and Tobago
-
 Tunisia
-
 Turkey
-
 UAE
UAE
-
 Uganda
-
 Ukraine
-
 United Kingdom
-
United States
-
 Uruguay
-
 Uzbekistan
-
 Venezuela
-
 Vietnam
-
 Yemen
Yemen
-
 Zambia
-
 Zimbabwe
- Forex
- Crypto
