
ADP stock price forecast: $220.81 resistance caps gains as ADP trades flat

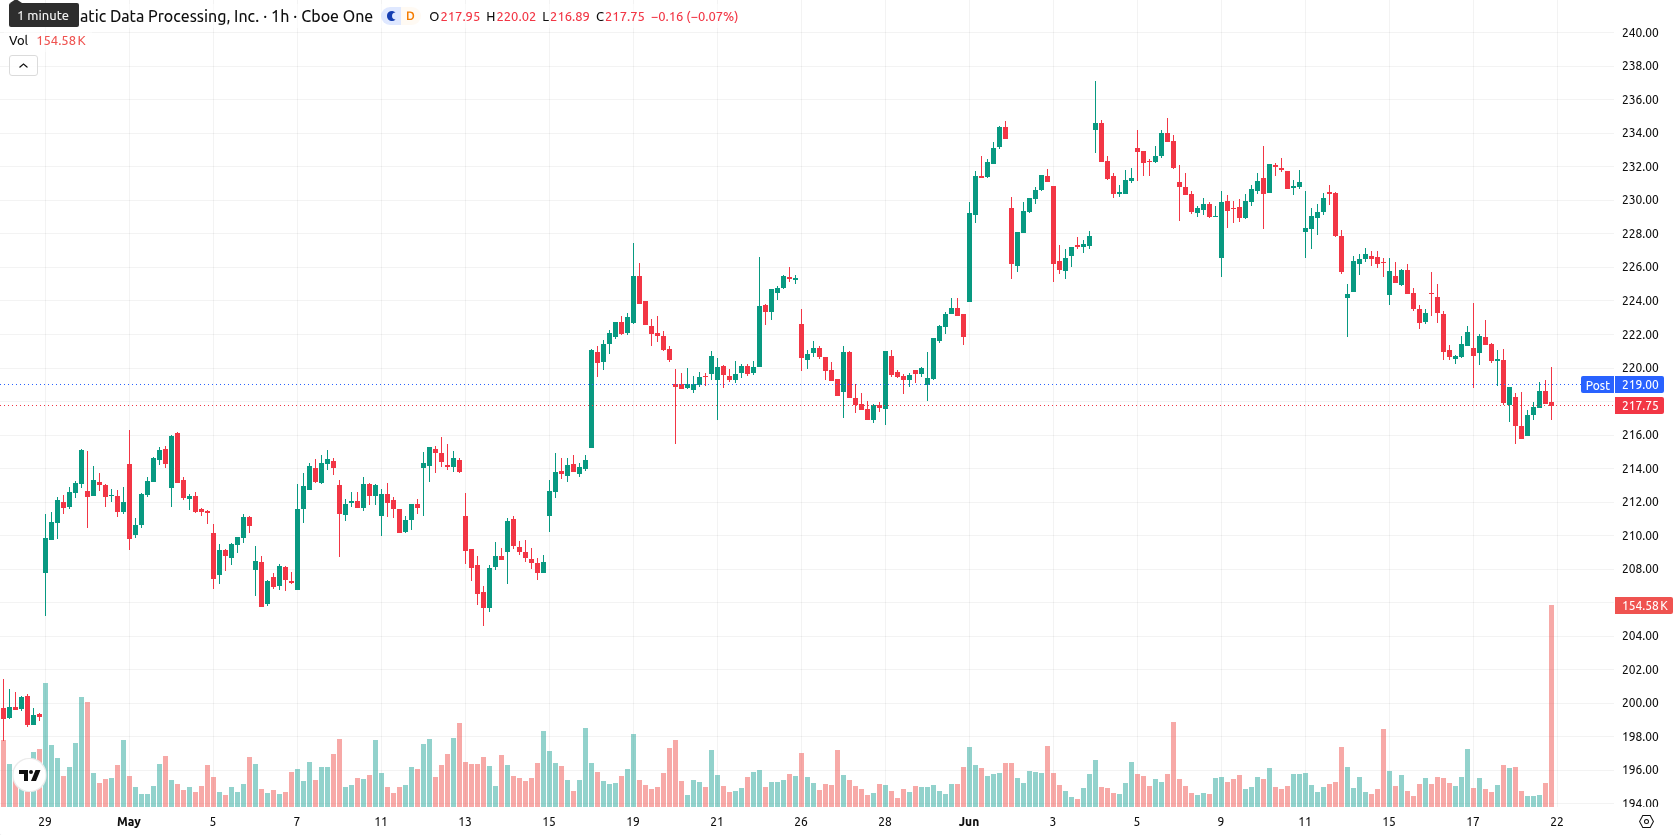
Automatic Data Processing (ADP) stock is trading at $218.41, down 0.16% for the day. The price is positioned below its key moving averages, signaling continued near-term weakness.
Highlights
- ADP/USD maintains a firmly bearish trend, trading below key moving averages on both short and long timeframes.
- Bearish momentum dominates, with sell signals from MACD, ADX, and RSI despite some intraday buying pressure.
- Price is expected to move between $213.78 and $223.04, with more than 80% probability favoring further downside.
Mixed signals as short-term overbought counters broader sell momentum
On the hourly chart, ADP is trading below the MA-20 ($219.67) and MA-50 ($224.45), while on the daily timeframe, it remains under the MA-200 ($243.41). The Ichimoku Kijun at $220.81 acts as immediate resistance. Momentum indicators show continued negative bias: MACD and ADX both signal a sell, RSI stands at 43.46 (Sell), Stoch RSI is Overbought, while CCI is Neutral. The BBP registers as Overbought, showing a recent surge from buyers despite the predominantly bearish technical landscape. The Awesome Oscillator remains Neutral, indicating no decisive directional momentum. There is divergence, with short-term overbought oscillators contradicting the underlying sell momentum.
Downside favored as volatility band contains price action
Over the next several sessions, ADP is expected to fluctuate within a volatility band of $213.78 to $223.04. The scenario with the highest probability is price consolidation inside this range, with an up-move considered unlikely (less than 20% probability) and any sustained downward move seen as more probable (greater than 80%). A break above $220.81 would open room for additional gains, while a drop through $213.78 could accelerate declines.
Earlier, analysts noted that positive momentum in U.S. private-sector hiring supported near-term optimism despite market uncertainty and inflationary pressures. The current technical setup for ADP, however, signals a shift toward sustained weakness, making a decisive move below $213.78 a key downside risk to monitor.


Latest Automatic Data Processing News


-
 Afghanistan
-
 Albania
-
 Algeria
-
 Angola
-
 Argentina
-
 Armenia
-
 Australia
-
 Austria
-
 Azerbaijan
-
 Bahamas
-
 Bahrain
-
 Bangladesh
-
 Belarus
-
 Belgium
-
 Bolivia
-
 Botswana
-
 Brazil
-
 Brunei
-
 Bulgaria
-
 Cambodia
-
 Cameroon
-
 Canada
-
 Chile
Chile
-
 China
China
-
 Colombia
-
 Congo
Congo
-
 Costa Rica
-
 Cote d'Ivoire
-
 Croatia
-
 Cuba
Cuba
-
 Cyprus
-
 Czechia
-
 DR Congo
-
 Denmark
-
 Dominican Republic
-
 Ecuador
-
 Egypt
Egypt
-
 El Salvador
-
 Estonia
-
 Eswatini
-
 Ethiopia
-
 Finland
-
 France
-
 Georgia
-
 Germany
-
 Ghana
Ghana
-
 Greece
-
 Haiti
Haiti
-
 Hong Kong
-
 Hungary
-
 India
India
-
 Indonesia
-
 Iran, Islamic republic
-
 Iraq
Iraq
-
 Ireland
-
 Israel
-
 Italy
Italy
-
 Jamaica
-
 Japan
Japan
-
 Jordan
-
 Kazakhstan
-
 Kenya
Kenya
-
 Korea
Korea
-
 Kuwait
-
 Kyrgyzstan
-
 Laos
Laos
-
 Latvia
-
 Lebanon
-
 Lesotho
-
 Libya
Libya
-
 Lithuania
-
 Luxembourg
-
 Madagascar
-
 Malaysia
-
 Malta
Malta
-
 Mauritius
-
 Mexico
-
 Moldova
-
 Mongolia
-
 Montenegro
-
 Morocco
-
 Mozambique
-
 Myanmar
-
 Namibia
-
 Nepal
Nepal
-
 Netherlands
-
 New Zealand
-
 Nigeria
-
 North Macedonia
-
 Norway
-
 Oman
Oman
-
 Pakistan
-
 Palestine
-
 Panama
-
 Papua New Guinea
-
 Paraguay
-
 Peru
Peru
-
 Philippines
-
 Poland
-
 Portugal
-
 Puerto Rico
-
 Qatar
Qatar
-
 Reunion
-
 Romania
-
 Rwanda
-
 Saudi Arabia
-
 Serbia
-
 Singapore
-
 Slovakia
-
 Slovenia
-
 Somalia
-
 South Africa
-
 Spain
Spain
-
 Sri Lanka
-
 Sweden
-
 Switzerland
-
 Syria
Syria
-
 Taiwan
-
 Tajikistan
-
 Tanzania
-
 Thailand
-
 Trinidad and Tobago
-
 Tunisia
-
 Turkey
-
 UAE
UAE
-
 Uganda
-
 Ukraine
-
 United Kingdom
-
United States
-
 Uruguay
-
 Uzbekistan
-
 Venezuela
-
 Vietnam
-
 Yemen
Yemen
-
 Zambia
-
 Zimbabwe
- Forex
- Crypto
