
Intuit stock jumps 4.59% as buyers step in on short-term uptrend

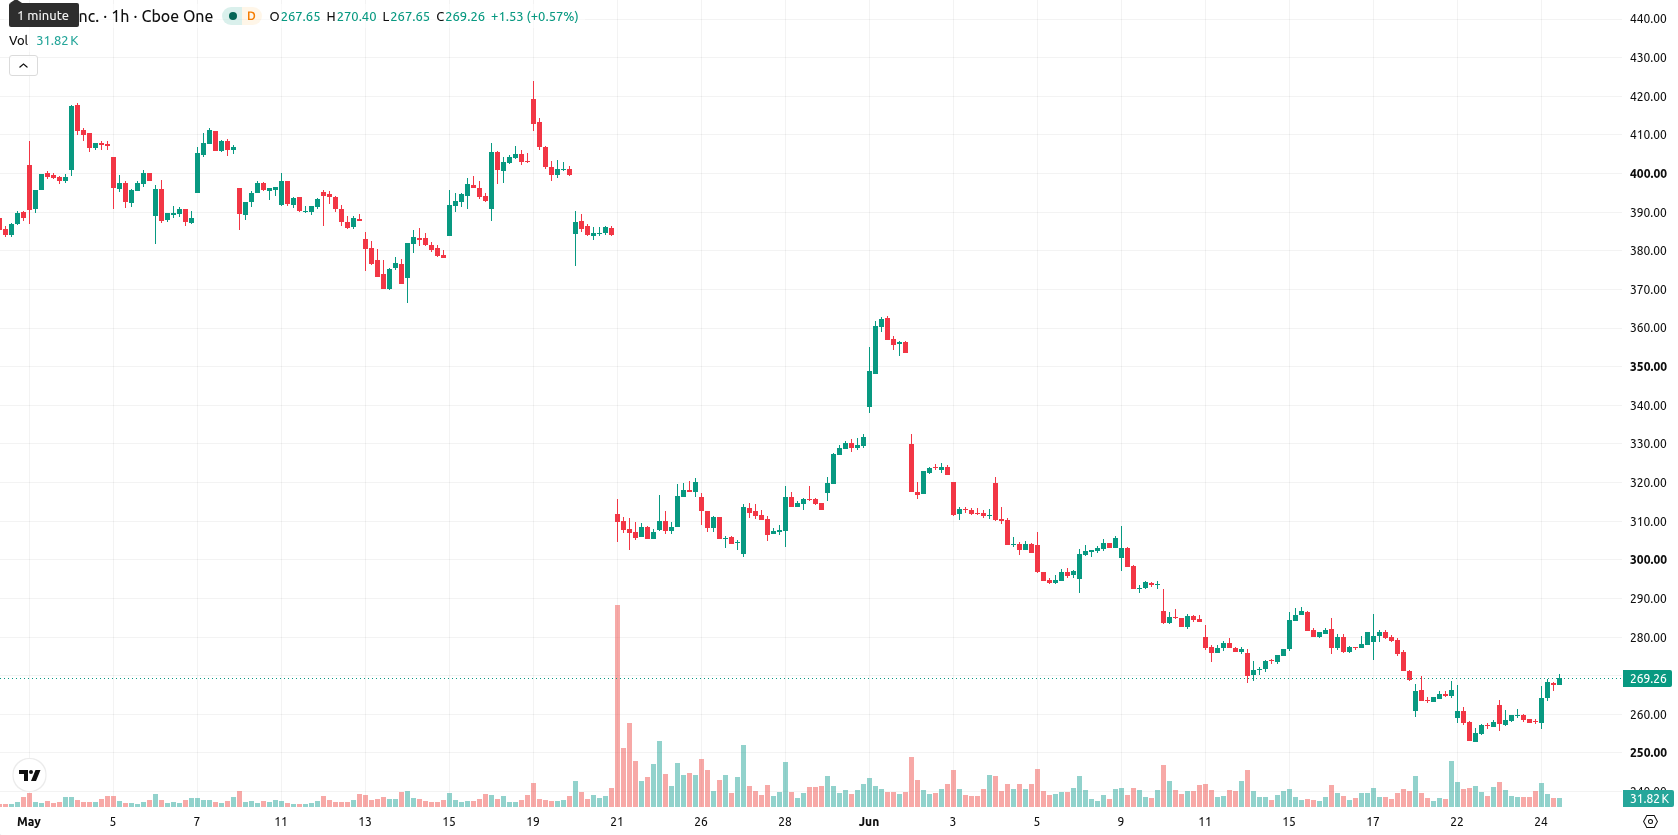
Intuit Inc. (INTU) stock is trading at $270.13 after rising 4.59% on the day. The price sits above its key short- and medium-term moving averages, but remains below major long-term averages.
Highlights
- Intuit missed expectations for the tax season, facing weaker demand from its most price-sensitive TurboTax online customers.
- Projected growth in TurboTax paying units was limited to 2% as IRS filing activity softened, driving operational concerns.
- Technical indicators suggest increased volatility with downside risk prevailing, as INTU is likely to fluctuate between $262.57 and $277.69.
TurboTax demand disappoints as pricing pressures prompt legal scrutiny
Intuit recently disclosed that it did not meet its overall expectations for the tax season and faced pressure among its most price-sensitive do-it-yourself filers, according to FinancialContent. The company reported that TurboTax online paying units were projected to rise by just 2%, with a modest decline in anticipated IRS filers, signaling softer demand in its core business segment. This disappointment has prompted Pomerantz LLP to investigate claims on behalf of Intuit investors, casting a spotlight on the company's operational challenges in a crucial revenue period.
Conflicting momentum and overbought signals amid mixed technical support
On the technical side, INTU trades above its 20-period and 50-period moving averages on the hourly chart but remains below the 200-period moving average on the daily timeframe. The Ichimoku Kijun level at $264.69 serves as immediate support. Divergent momentum signals are evident: the Moving Average Convergence Divergence (MACD) shows strong selling pressure, while the Average Directional Index (ADX) indicates buyer control. The Relative Strength Index (RSI) remains in neutral-bullish territory, yet Stochastic RSI, Commodity Channel Index (CCI), and Bull/Bear Power all signal overbought conditions with pronounced buyer dominance. The Awesome Oscillator is neutral, resulting in conflicting technical signals across momentum and oscillator readings.
Rangebound outlook as downside risk outpaces bullish breakout potential
Over the next several sessions, INTU is expected to oscillate between $262.57 and $277.69, reflecting a typical volatility band relative to current levels. Downside movement is more likely, with a 64% probability of declining versus a 36% chance of a continued rally. The base-case scenario sees INTU ranging sideways between the defined support and resistance. A decisive move above $277.69 could signal a bullish breakout, while a firm breach of $264.69 would favor a bearish continuation.
Previously it was reported that Intuit's shares faced persistent downside momentum due to competitive pressures and restructuring challenges. With the current mix of conflicting technical signals and new headwinds in TurboTax growth, investors should closely monitor for a potential shift in trend should Intuit decisively break above the $277.69 resistance or fall below immediate support at $264.69.


Latest Intuit News


-
 Afghanistan
-
 Albania
-
 Algeria
-
 Angola
-
 Argentina
-
 Armenia
-
 Australia
-
 Austria
-
 Azerbaijan
-
 Bahamas
-
 Bahrain
-
 Bangladesh
-
 Belarus
-
 Belgium
-
 Bolivia
-
 Botswana
-
 Brazil
-
 Brunei
-
 Bulgaria
-
 Cambodia
-
 Cameroon
-
 Canada
-
 Chile
Chile
-
 China
China
-
 Colombia
-
 Congo
Congo
-
 Costa Rica
-
 Cote d'Ivoire
-
 Croatia
-
 Cuba
Cuba
-
 Cyprus
-
 Czechia
-
 DR Congo
-
 Denmark
-
 Dominican Republic
-
 Ecuador
-
 Egypt
Egypt
-
 El Salvador
-
 Estonia
-
 Eswatini
-
 Ethiopia
-
 Finland
-
 France
-
 Georgia
-
 Germany
-
 Ghana
Ghana
-
 Greece
-
 Haiti
Haiti
-
 Hong Kong
-
 Hungary
-
 India
India
-
 Indonesia
-
 Iran, Islamic republic
-
 Iraq
Iraq
-
 Ireland
-
 Israel
-
 Italy
Italy
-
 Jamaica
-
 Japan
Japan
-
 Jordan
-
 Kazakhstan
-
 Kenya
Kenya
-
 Korea
Korea
-
 Kuwait
-
 Kyrgyzstan
-
 Laos
Laos
-
 Latvia
-
 Lebanon
-
 Lesotho
-
 Libya
Libya
-
 Lithuania
-
 Luxembourg
-
 Madagascar
-
 Malaysia
-
 Malta
Malta
-
 Mauritius
-
 Mexico
-
 Moldova
-
 Mongolia
-
 Montenegro
-
 Morocco
-
 Mozambique
-
 Myanmar
-
 Namibia
-
 Nepal
Nepal
-
 Netherlands
-
 New Zealand
-
 Nigeria
-
 North Macedonia
-
 Norway
-
 Oman
Oman
-
 Pakistan
-
 Palestine
-
 Panama
-
 Papua New Guinea
-
 Paraguay
-
 Peru
Peru
-
 Philippines
-
 Poland
-
 Portugal
-
 Puerto Rico
-
 Qatar
Qatar
-
 Reunion
-
 Romania
-
 Rwanda
-
 Saudi Arabia
-
 Serbia
-
 Singapore
-
 Slovakia
-
 Slovenia
-
 Somalia
-
 South Africa
-
 Spain
Spain
-
 Sri Lanka
-
 Sweden
-
 Switzerland
-
 Syria
Syria
-
 Taiwan
-
 Tajikistan
-
 Tanzania
-
 Thailand
-
 Trinidad and Tobago
-
 Tunisia
-
 Turkey
-
 UAE
UAE
-
 Uganda
-
 Ukraine
-
 United Kingdom
-
United States
-
 Uruguay
-
 Uzbekistan
-
 Venezuela
-
 Vietnam
-
 Yemen
Yemen
-
 Zambia
-
 Zimbabwe
- Forex
- Crypto
