
O'Reilly Automotive stock drops 5.65% as potential Genuine Parts auto unit acquisition faces antitrust scrutiny

O'Reilly Automotive (ORLY) stock is trading at $85.16, down 5.65% today. The price remains below its key moving averages, reflecting persistent short-term and long-term selling momentum.
 86.30
88.02
86.30
88.02
Highlights
- O'Reilly Automotive's plan to acquire Genuine Parts' auto business faces potential antitrust scrutiny due to significant store overlap near NAPA locations.
- Analysts estimate that up to 1,000 stores could require regulatory review, heightening operational and transaction uncertainty for O'Reilly.
- ORLY trades below major technical levels amidst broad selling pressure, with a projected range of $76.52–$87.52 and ongoing bearish momentum.
Regulatory scrutiny intensifies as merger overlap triggers caution
O'Reilly Automotive faces the prospect of regulatory scrutiny and potential divestiture requirements if it moves forward with acquiring Genuine Parts’ auto business, as outlined by Barclays and reported by Investing.com. This stems from an analysis indicating that around 61% of the company's stores are located near a NAPA location, creating possible overlap concerns for antitrust regulators and adding significant operational uncertainty. The possibility that 500 to 1,000 store markets could be subjected to regulatory review has contributed to a more cautious investor stance.
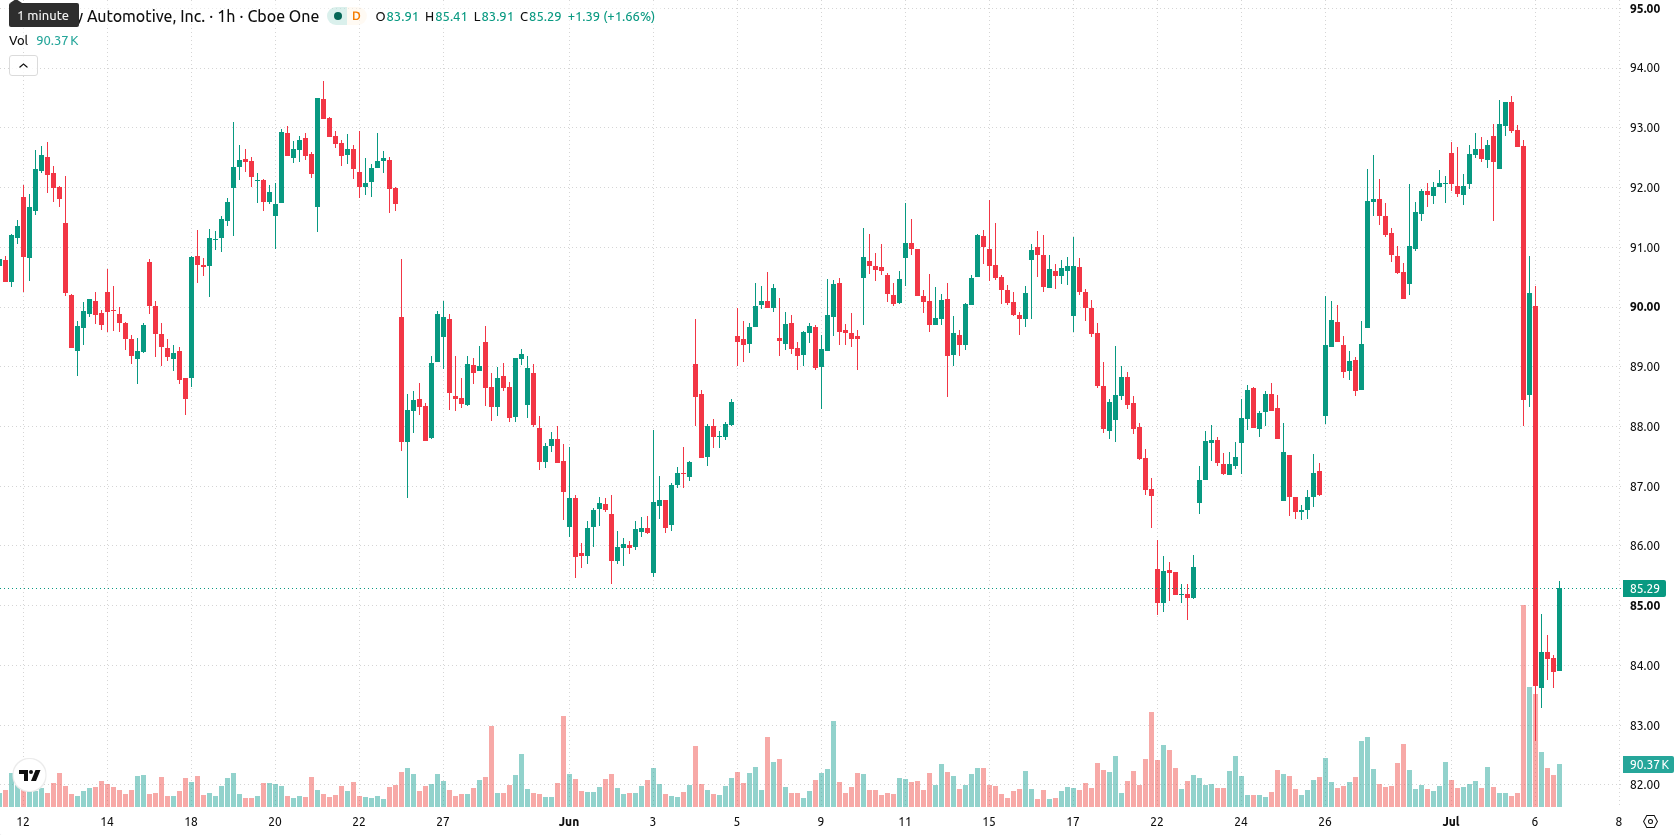
Multiple moving averages breached as bearish momentum accelerates
ORLY has broken below its 20-day, 50-day, and 200-day simple moving averages, set at $90.19, $89.8, and $94.83, respectively. Immediate resistance is defined by the Ichimoku Kijun level at $88.45. Momentum indicators present a bearish alignment, with both the Moving Average Convergence Divergence (MACD) and Average Directional Index (ADX) supporting continued downside pressure. Relative Strength Index (RSI), Commodity Channel Index (CCI), and Stochastic RSI all indicate oversold conditions, while the negative Bull/Bear Power (BBP) and a falling Awesome Oscillator confirm strong intraday seller dominance.
Downside risks dominate as volatility bands constrain recovery
Over the next several sessions, the most likely scenario is for ORLY to trade within a range of $76.52 to $87.52, reflecting the current volatility band relative to recent levels. A clear move above $88.45 could trigger a recovery toward resistance, but with only a 30% probability for this upside scenario. In contrast, a decisive break below $76.52 would signal further downside risk, with downside probabilities prevailing given current technical and news headwinds.
Earlier, analysts noted that O'Reilly Automotive was experiencing mixed momentum signals and faced technical resistance that suggested limited upside. The current environment not only reinforces this cautious outlook with intensifying downside pressure, but also introduces significant regulatory risk, making any sustained move above the $88.45 resistance level a pivotal signal for traders monitoring potential recovery.


Latest O’Reilly Automotive News






-
 Afghanistan
-
 Albania
-
 Algeria
-
 Angola
-
 Argentina
-
 Armenia
-
 Australia
-
 Austria
-
 Azerbaijan
-
 Bahamas
-
 Bahrain
-
 Bangladesh
-
 Belarus
-
 Belgium
-
 Bolivia
-
 Botswana
-
 Brazil
-
 Brunei
-
 Bulgaria
-
 Cambodia
-
 Cameroon
-
 Canada
-
 Chile
Chile
-
 China
China
-
 Colombia
-
 Congo
Congo
-
 Costa Rica
-
 Cote d'Ivoire
-
 Croatia
-
 Cuba
Cuba
-
 Cyprus
-
 Czechia
-
 DR Congo
-
 Denmark
-
 Dominican Republic
-
 Ecuador
-
 Egypt
Egypt
-
 El Salvador
-
 Estonia
-
 Eswatini
-
 Ethiopia
-
 Finland
-
 France
-
 Georgia
-
 Germany
-
 Ghana
Ghana
-
 Greece
-
 Haiti
Haiti
-
 Hong Kong
-
 Hungary
-
 India
India
-
 Indonesia
-
 Iran, Islamic republic
-
 Iraq
Iraq
-
 Ireland
-
 Israel
-
 Italy
Italy
-
 Jamaica
-
 Japan
Japan
-
 Jordan
-
 Kazakhstan
-
 Kenya
Kenya
-
 Korea
Korea
-
 Kuwait
-
 Kyrgyzstan
-
 Laos
Laos
-
 Latvia
-
 Lebanon
-
 Lesotho
-
 Libya
Libya
-
 Lithuania
-
 Luxembourg
-
 Madagascar
-
 Malaysia
-
 Malta
Malta
-
 Mauritius
-
 Mexico
-
 Moldova
-
 Mongolia
-
 Montenegro
-
 Morocco
-
 Mozambique
-
 Myanmar
-
 Namibia
-
 Nepal
Nepal
-
 Netherlands
-
 New Zealand
-
 Nigeria
-
 North Macedonia
-
 Norway
-
 Oman
Oman
-
 Pakistan
-
 Palestine
-
 Panama
-
 Papua New Guinea
-
 Paraguay
-
 Peru
Peru
-
 Philippines
-
 Poland
-
 Portugal
-
 Puerto Rico
-
 Qatar
Qatar
-
 Reunion
-
 Romania
-
 Rwanda
-
 Saudi Arabia
-
 Serbia
-
 Singapore
-
 Slovakia
-
 Slovenia
-
 Somalia
-
 South Africa
-
 Spain
Spain
-
 Sri Lanka
-
 Sweden
-
 Switzerland
-
 Syria
Syria
-
 Taiwan
-
 Tajikistan
-
 Tanzania
-
 Thailand
-
 Trinidad and Tobago
-
 Tunisia
-
 Turkey
-
 UAE
UAE
-
 Uganda
-
 Ukraine
-
 United Kingdom
-
United States
-
 Uruguay
-
 Uzbekistan
-
 Venezuela
-
 Vietnam
-
 Yemen
Yemen
-
 Zambia
-
 Zimbabwe
- Forex
- Crypto











