
Will AST SpaceMobile stock avoid deeper losses as oversold conditions limit further selling?

AST SpaceMobile (ASTS) stock is trading at $67.58, down 7.83% for the session after a high-volatility move. The price has fallen below its key moving averages, indicating significant momentum to the downside in the short and medium term.
 70.20
75.53
70.20
75.53
Highlights
- AST SpaceMobile secured regulatory approval to establish satellite gateway operations in New Zealand, facilitating integration with local telecom networks.
- Although this expansion enhances AST SpaceMobile’s deployment options and geographic reach, the stock remains under market-wide selling pressure.
- Technicals indicate strong and persistent bearish momentum, with price expected to trade between $61.63 and $73.53 amid limited prospects for a near-term reversal.
Operational reach expands as New Zealand gateway secures approval
AST SpaceMobile received a gateway license from New Zealand’s Register of Radio Frequencies, enabling Two Degrees Networks to operate a ground station that connects AST SpaceMobile’s non-geostationary satellites to local telecom networks, according to Stocktwits. This regulatory approval expands the company's technical deployment options, providing a direct pathway to integrate satellite connectivity services within New Zealand’s telecommunications market. Although this development can broaden AST SpaceMobile’s operational reach, price action has remained under broader selling pressure.
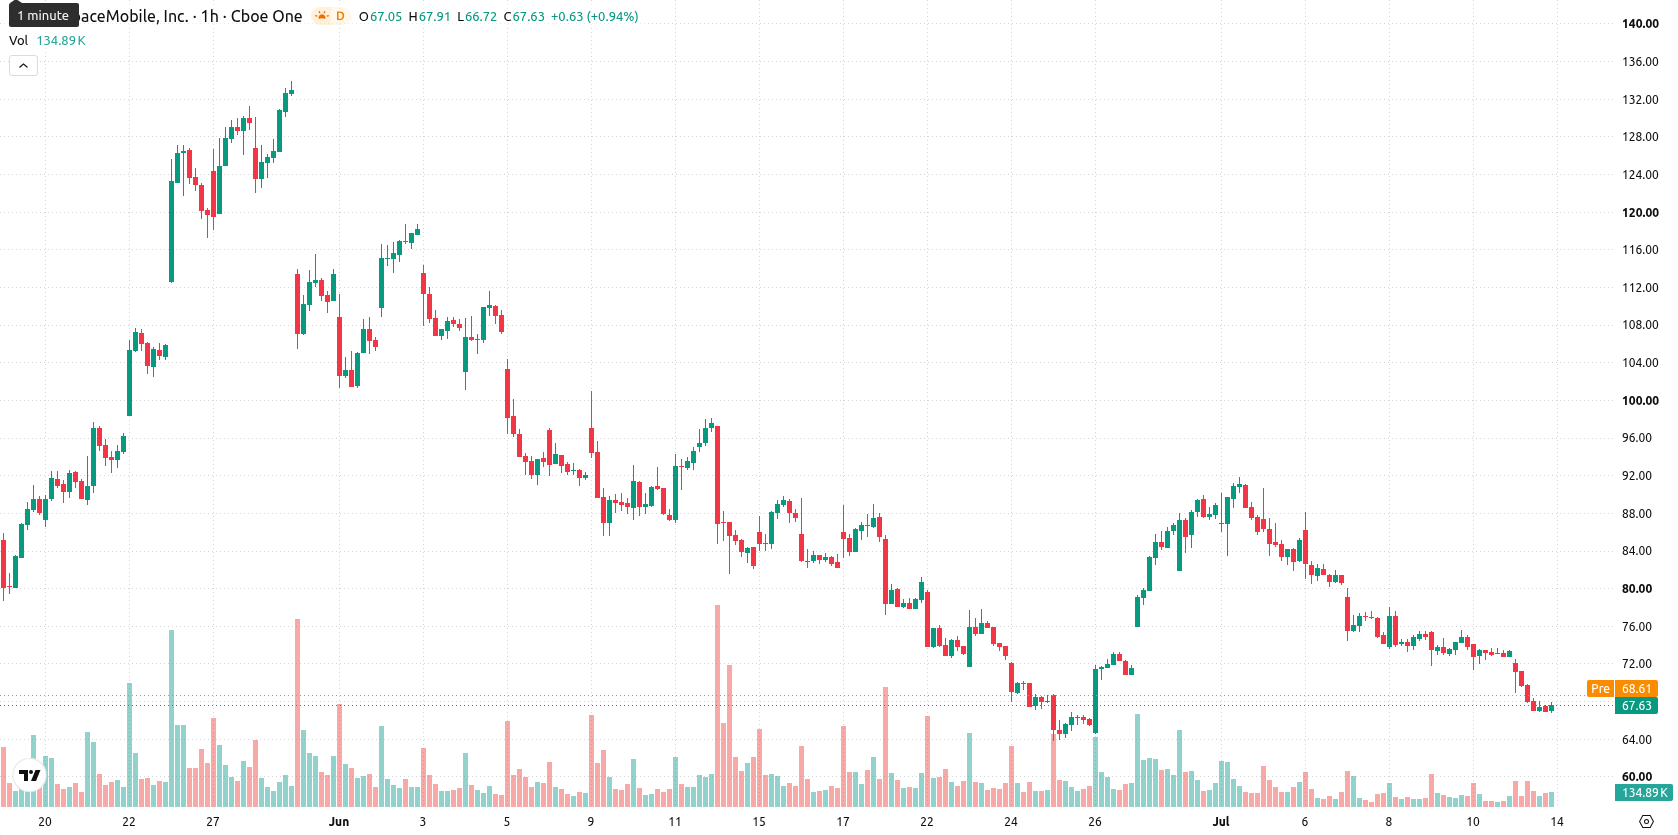
Bearish momentum confirmed as price breaches major support zones
On the technical front, ASTS is trading below the 20-period ($71.66) and 50-period ($76.22) moving averages on the hourly timeframe and remains below the 200-period moving average ($83) on the daily chart. The Ichimoku Kijun at $71.16 represents the nearest resistance. Momentum indicators present a strongly bearish structure: the Moving Average Convergence Divergence (MACD), Average Directional Index (ADX), and the Awesome Oscillator all flag sell signals. The Relative Strength Index (RSI) stands at 28.62, and the Commodity Channel Index (CCI) is in oversold territory, both confirming dominant selling activity, while Bull/Bear Power also reflects oversold conditions. Stochastic RSI is neutral, reflecting indecision among short-term oscillators.
Volatility elevated as price oscillates within defined corridor
In the short term, price action is likely to remain volatile, with a projected range between $61.63 and $73.53. There is a 74% probability of continued downside, while a reversal higher has a much lower likelihood at 26%. If ASTS holds within this corridor, short-term consolidation is expected. A decisive move above $71.16 would point to a bullish breakout, whereas a drop below $61.63 would confirm further weakness in the prevailing volatility band relative to current levels.
Earlier, analysts noted that persistent selling pressure and weak momentum continued to weigh on AST SpaceMobile despite operational progress and new market approvals. The latest technical readings and fresh regulatory wins in New Zealand reinforce a bearish backdrop, highlighting $61.63 as the immediate downside risk level for traders to monitor.


Latest AST SpaceMobile News





-
 Afghanistan
-
 Albania
-
 Algeria
-
 Angola
-
 Argentina
-
 Armenia
-
 Australia
-
 Austria
-
 Azerbaijan
-
 Bahamas
-
 Bahrain
-
 Bangladesh
-
 Belarus
-
 Belgium
-
 Bolivia
-
 Botswana
-
 Brazil
-
 Brunei
-
 Bulgaria
-
 Cambodia
-
 Cameroon
-
 Canada
-
 Chile
Chile
-
 China
China
-
 Colombia
-
 Congo
Congo
-
 Costa Rica
-
 Cote d'Ivoire
-
 Croatia
-
 Cuba
Cuba
-
 Cyprus
-
 Czechia
-
 DR Congo
-
 Denmark
-
 Dominican Republic
-
 Ecuador
-
 Egypt
Egypt
-
 El Salvador
-
 Estonia
-
 Eswatini
-
 Ethiopia
-
 Finland
-
 France
-
 Georgia
-
 Germany
-
 Ghana
Ghana
-
 Greece
-
 Haiti
Haiti
-
 Hong Kong
-
 Hungary
-
 India
India
-
 Indonesia
-
 Iran, Islamic republic
-
 Iraq
Iraq
-
 Ireland
-
 Israel
-
 Italy
Italy
-
 Jamaica
-
 Japan
Japan
-
 Jordan
-
 Kazakhstan
-
 Kenya
Kenya
-
 Korea
Korea
-
 Kuwait
-
 Kyrgyzstan
-
 Laos
Laos
-
 Latvia
-
 Lebanon
-
 Lesotho
-
 Libya
Libya
-
 Lithuania
-
 Luxembourg
-
 Madagascar
-
 Malaysia
-
 Malta
Malta
-
 Mauritius
-
 Mexico
-
 Moldova
-
 Mongolia
-
 Montenegro
-
 Morocco
-
 Mozambique
-
 Myanmar
-
 Namibia
-
 Nepal
Nepal
-
 Netherlands
-
 New Zealand
-
 Nigeria
-
 North Macedonia
-
 Norway
-
 Oman
Oman
-
 Pakistan
-
 Palestine
-
 Panama
-
 Papua New Guinea
-
 Paraguay
-
 Peru
Peru
-
 Philippines
-
 Poland
-
 Portugal
-
 Puerto Rico
-
 Qatar
Qatar
-
 Reunion
-
 Romania
-
 Rwanda
-
 Saudi Arabia
-
 Serbia
-
 Singapore
-
 Slovakia
-
 Slovenia
-
 Somalia
-
 South Africa
-
 Spain
Spain
-
 Sri Lanka
-
 Sweden
-
 Switzerland
-
 Syria
Syria
-
 Taiwan
-
 Tajikistan
-
 Tanzania
-
 Thailand
-
 Trinidad and Tobago
-
 Tunisia
-
 Turkey
-
 UAE
UAE
-
 Uganda
-
 Ukraine
-
 United Kingdom
-
United States
-
 Uruguay
-
 Uzbekistan
-
 Venezuela
-
 Vietnam
-
 Yemen
Yemen
-
 Zambia
-
 Zimbabwe
- Forex
- Crypto











