

Why is SoFi stock down today? Selloff pushes price toward critical support level

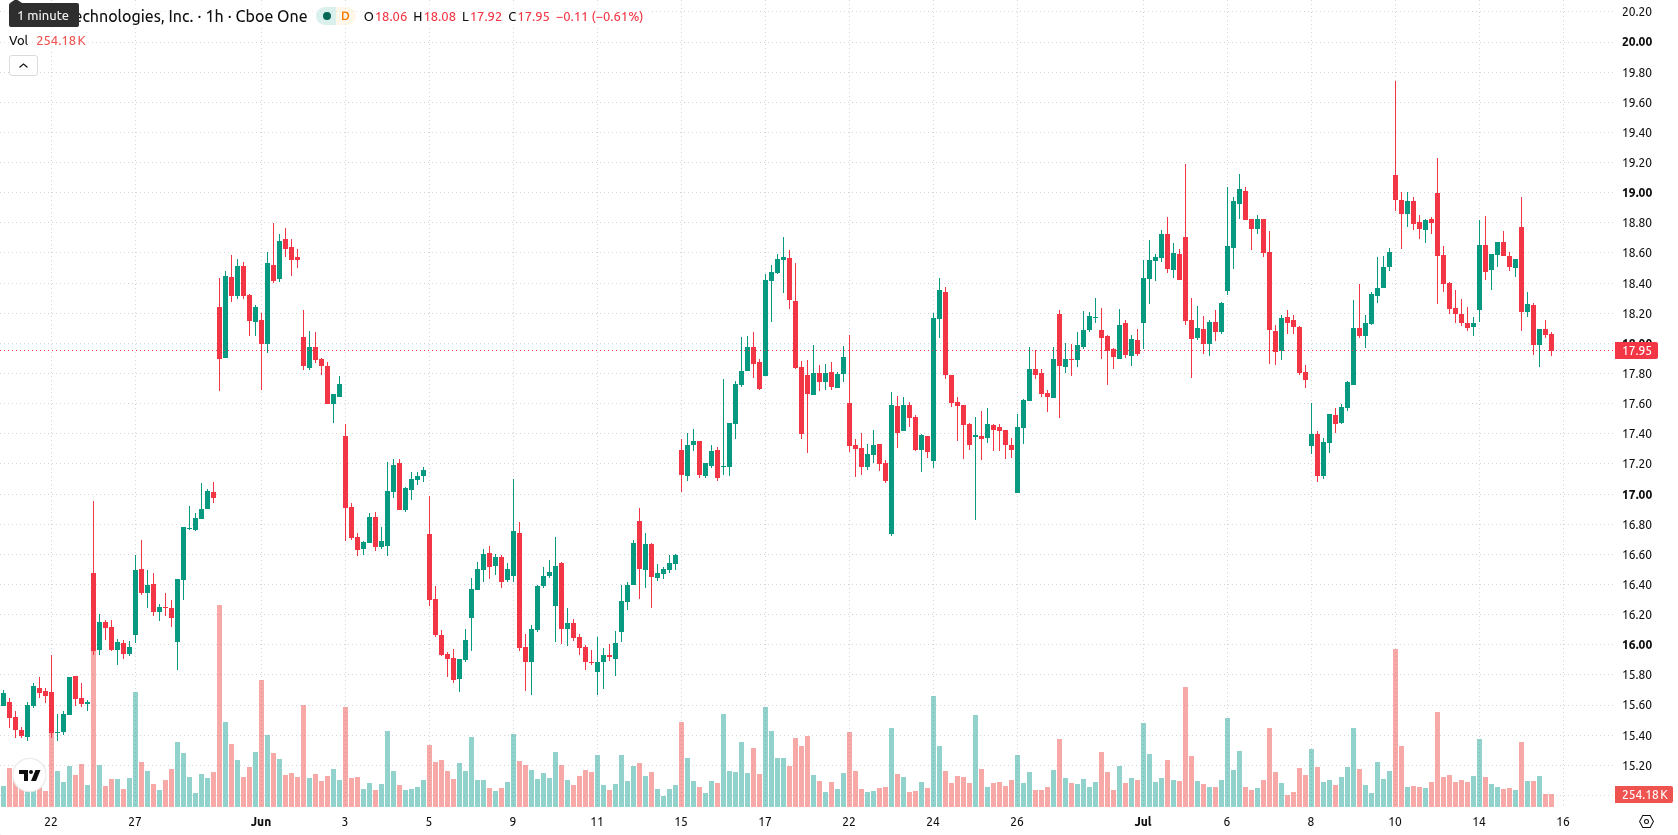
SoFi Technologies, Inc (SOFI) stock is trading at $17.95 following a 3.24% decline on the session, moving down sharply from its previous level. The price remains below its key moving averages, highlighting a persistent downtrend in line with recent technical pressure.
 15.68
16.09
15.68
16.09
Highlights
- SoFi grew total membership 35% year-over-year to 14.7 million in Q1 2026, reinforcing long-term revenue opportunities.
- Operational momentum continues as SoFi expands into small business loans with no fees and diversifies with new ETFs and savings products.
- SOFI/USD trades below major moving averages with technicals signaling strong selling, an expected $17.27–$18.63 range, and high downside risk.
Member growth and product launches bolster fundamentals amid seller dominance
In the first quarter of 2026, Sofi added 1.1 million new members, increasing its total membership by 35% year-over-year to 14.7 million, according to Barchart. This substantial expansion strengthens the platform's long-term revenue potential but comes as the market has already digested these gains. Separately, SoFi expanded its lending business by rolling out small business loans without application, origination, or prepayment fees, as noted by Cnbc, while product innovation continued with the introduction of new investment ETFs and enhanced savings offerings. These corporate actions indicate operational momentum and diversification, though price action has remained under broader selling pressure.
Weak momentum and seller control as price tests support bands
On the hourly chart, SOFI/USD is trading below its 20-period moving average ($18.32) and 50-period moving average ($18.24), while also remaining under the 200-period moving average at $21.97 on the daily timeframe. Immediate resistance is identified at the Ichimoku Kijun level of $18.54, with key support at $17.27 and an upper resistance band at $18.63. The Moving Average Convergence Divergence (MACD) indicates a sell signal, while the Average Directional Index (ADX) is neutral, underscoring weak momentum. The Relative Strength Index (RSI) is at 40.61 and the Stochastic RSI signals oversold conditions, with the Commodity Channel Index (CCI) also generating a sell reading. Both Bull/Bear Power and the Awesome Oscillator reflect prevailing seller dominance, and there are no significant divergences noted among oscillators or momentum indicators.
Further weakness likely as downside scenario dominates near-term range
Over the next few days, SOFI/USD is expected to trade within the $17.27 to $18.63 range, reflecting a typical volatility band relative to current levels. The forecast assigns a very high probability to continued downside price action and a very low probability for an upward move, making any rebound much less likely. In the baseline scenario, SOFI remains rangebound between these levels, with a bullish outcome contingent on a breakout above $18.54 resistance and a bearish scenario unfolding if price falls through $17.27 support, which could accelerate further weakness.
Earlier, analysts noted that SoFi Technologies was exhibiting near-term strength within a broader technical ceiling, underpinned by record membership growth and expanded lending initiatives. The current environment, however, reflects a shift to sustained downward momentum and heightened seller control, making the $17.27 support level critical to watch for potential downside acceleration in the days ahead.










-
 Afghanistan
-
 Albania
-
 Algeria
-
 Angola
-
 Argentina
-
 Armenia
-
 Australia
-
 Austria
-
 Azerbaijan
-
 Bahamas
-
 Bahrain
-
 Bangladesh
-
 Belarus
-
 Belgium
-
 Bolivia
-
 Botswana
-
 Brazil
-
 Brunei
-
 Bulgaria
-
 Cambodia
-
 Cameroon
-
 Canada
-
 Chile
Chile
-
 China
China
-
 Colombia
-
 Congo
Congo
-
 Costa Rica
-
 Cote d'Ivoire
-
 Croatia
-
 Cuba
Cuba
-
 Cyprus
-
 Czechia
-
 DR Congo
-
 Denmark
-
 Dominican Republic
-
 Ecuador
-
 Egypt
Egypt
-
 El Salvador
-
 Estonia
-
 Eswatini
-
 Ethiopia
-
 Finland
-
 France
-
 Georgia
-
 Germany
-
 Ghana
Ghana
-
 Greece
-
 Haiti
Haiti
-
 Hong Kong
-
 Hungary
-
 India
India
-
 Indonesia
-
 Iran, Islamic republic
-
 Iraq
Iraq
-
 Ireland
-
 Israel
-
 Italy
Italy
-
 Jamaica
-
 Japan
Japan
-
 Jordan
-
 Kazakhstan
-
 Kenya
Kenya
-
 Korea
Korea
-
 Kuwait
-
 Kyrgyzstan
-
 Laos
Laos
-
 Latvia
-
 Lebanon
-
 Lesotho
-
 Libya
Libya
-
 Lithuania
-
 Luxembourg
-
 Madagascar
-
 Malaysia
-
 Malta
Malta
-
 Mauritius
-
 Mexico
-
 Moldova
-
 Mongolia
-
 Montenegro
-
 Morocco
-
 Mozambique
-
 Myanmar
-
 Namibia
-
 Nepal
Nepal
-
 Netherlands
-
 New Zealand
-
 Nigeria
-
 North Macedonia
-
 Norway
-
 Oman
Oman
-
 Pakistan
-
 Palestine
-
 Panama
-
 Papua New Guinea
-
 Paraguay
-
 Peru
Peru
-
 Philippines
-
 Poland
-
 Portugal
-
 Puerto Rico
-
 Qatar
Qatar
-
 Reunion
-
 Romania
-
 Rwanda
-
 Saudi Arabia
-
 Serbia
-
 Singapore
-
 Slovakia
-
 Slovenia
-
 Somalia
-
 South Africa
-
 Spain
Spain
-
 Sri Lanka
-
 Sweden
-
 Switzerland
-
 Syria
Syria
-
 Taiwan
-
 Tajikistan
-
 Tanzania
-
 Thailand
-
 Trinidad and Tobago
-
 Tunisia
-
 Turkey
-
 UAE
UAE
-
 Uganda
-
 Ukraine
-
 United Kingdom
-
United States
-
 Uruguay
-
 Uzbekistan
-
 Venezuela
-
 Vietnam
-
 Yemen
Yemen
-
 Zambia
-
 Zimbabwe
- Forex
- Crypto












