

Stryker stock breaks $314.99 support after quarterly revenue misses consensus forecast

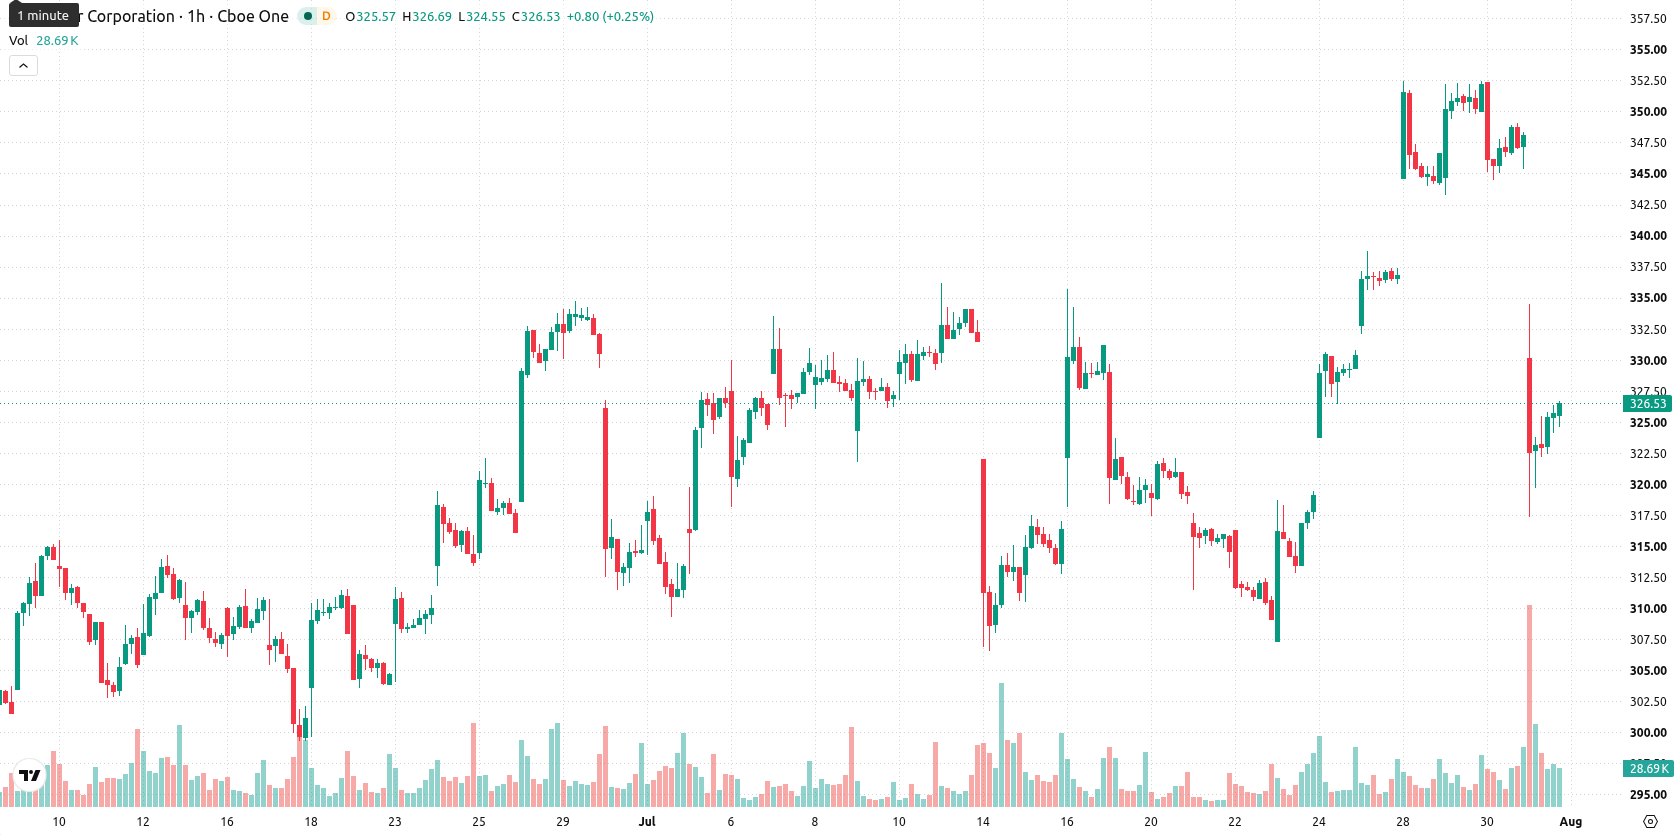
Stryker (SYK) stock is trading at $327.77, marking a daily decline of 5.83%. The share price currently sits below its key moving averages, reflecting ongoing weakness in the short and medium term.
 330.33
346.91
Highlights
- Stryker exceeded Q2 2026 EPS expectations at $3.69 while delivering 9% organic sales growth and raising full-year guidance.
- Quarterly revenue of $6.59 billion missed consensus, but management signaled confidence by restarting share buybacks and pursuing acquisitions.
- SYK trades below key moving averages with negative momentum; 2–3 day range seen at $314.99–$336.97, with bearish pressure dominant.
Mixed results as EPS beats but revenue misses estimates
Stryker reported second quarter 2026 earnings per share of $3.69, surpassing consensus estimates and highlighting profitability outperformance, according to Globenewswire. However, quarterly revenue reached $6.59 billion, coming in just below expectations and reflecting a modest top-line shortfall. The company also posted 9% organic sales growth, raised its full-year guidance, and announced the resumption of share repurchases, signaling management’s confidence and ongoing commitment to shareholder returns. Stryker’s continued prioritization of mergers and acquisitions rounds out a series of constructive developments, though price action has remained under broader selling pressure.
Bearish momentum intensifies as multiple indicators signal selling
On the technical front, SYK trades below its MA-20 and MA-50 on the hourly chart and remains underneath the MA-200 on the daily timeframe, with the Ichimoku Kijun at $335.57 acting as immediate resistance. Momentum indicators are firmly negative: MACD and ADX both issue Sell signals, RSI is in the Sell zone at 33.71, and Stoch RSI, CCI, and Bull/Bear Power all indicate oversold intraday conditions. The Awesome Oscillator mirrors this downward bias, with persistent seller momentum confirmed by price action and no notable divergence detected among oscillators.
Downside risk prevails amid limited prospects for reversal
Over the coming 2–3 days, SYK is expected to trade within the $314.99 to $336.97 volatility band. A downward move remains favored with 70% probability, while the likelihood of a bullish reversal is limited at 30%. The baseline scenario calls for price consolidation within these boundaries, though a decisive break above $335.57 could trigger short-term recovery attempts, while a fall below $314.99 would signal continuation of the existing downtrend.
Earlier, analysts noted that Stryker faced persistent selling pressure and a weakening technical setup despite fundamentally positive earnings and M&A activity. The current deterioration in momentum indicators and deepening oversold conditions reinforce the ongoing downside bias, making a break below $314.99 a critical risk point for further declines.






Latest Stryker Corporation News




-
 Afghanistan
-
 Albania
-
 Algeria
-
 Angola
-
 Argentina
-
 Armenia
-
 Australia
-
 Austria
-
 Azerbaijan
-
 Bahamas
-
 Bahrain
-
 Bangladesh
-
 Belarus
-
 Belgium
-
 Bolivia
-
 Botswana
-
 Brazil
-
 Brunei
-
 Bulgaria
-
 Cambodia
-
 Cameroon
-
 Canada
-
 Chile
-
 China
-
 Colombia
-
 Congo
-
 Costa Rica
-
 Cote d'Ivoire
-
 Croatia
-
 Cuba
-
 Cyprus
-
 Czechia
-
 DR Congo
-
 Denmark
-
 Dominican Republic
-
 Ecuador
-
 Egypt
-
 El Salvador
-
 Estonia
-
 Eswatini
-
 Ethiopia
-
 Finland
-
 France
-
 Georgia
-
 Germany
-
 Ghana
-
 Greece
-
 Haiti
-
 Hong Kong
-
 Hungary
-
 India
-
 Indonesia
-
 Iran, Islamic republic
-
 Iraq
-
 Ireland
-
 Israel
-
 Italy
-
 Jamaica
-
 Japan
-
 Jordan
-
 Kazakhstan
-
 Kenya
-
 Korea
-
 Kuwait
-
 Kyrgyzstan
-
 Laos
-
 Latvia
-
 Lebanon
-
 Lesotho
-
 Libya
-
 Lithuania
-
 Luxembourg
-
 Madagascar
-
 Malaysia
-
 Malta
-
 Mauritius
-
 Mexico
-
 Moldova
-
 Mongolia
-
 Montenegro
-
 Morocco
-
 Mozambique
-
 Myanmar
-
 Namibia
-
 Nepal
-
 Netherlands
-
 New Zealand
-
 Nigeria
-
 North Macedonia
-
 Norway
-
 Oman
-
 Pakistan
-
 Palestine
-
 Panama
-
 Papua New Guinea
-
 Paraguay
-
 Peru
-
 Philippines
-
 Poland
-
 Portugal
-
 Puerto Rico
-
 Qatar
-
 Reunion
-
 Romania
-
 Rwanda
-
 Saudi Arabia
-
 Serbia
-
 Singapore
-
 Slovakia
-
 Slovenia
-
 Somalia
-
 South Africa
-
 Spain
-
 Sri Lanka
-
 Sweden
-
 Switzerland
-
 Syria
-
 Taiwan
-
 Tajikistan
-
 Tanzania
-
 Thailand
-
 Trinidad and Tobago
-
 Tunisia
-
 Turkey
-
 UAE
-
 Uganda
-
 Ukraine
-
 United Kingdom
-
United States
-
 Uruguay
-
 Uzbekistan
-
 Venezuela
-
 Vietnam
-
 Yemen
-
 Zambia
-
 Zimbabwe
- Forex
- Crypto












