

Narrowing quarterly net losses: TLRY resistance levels in focus

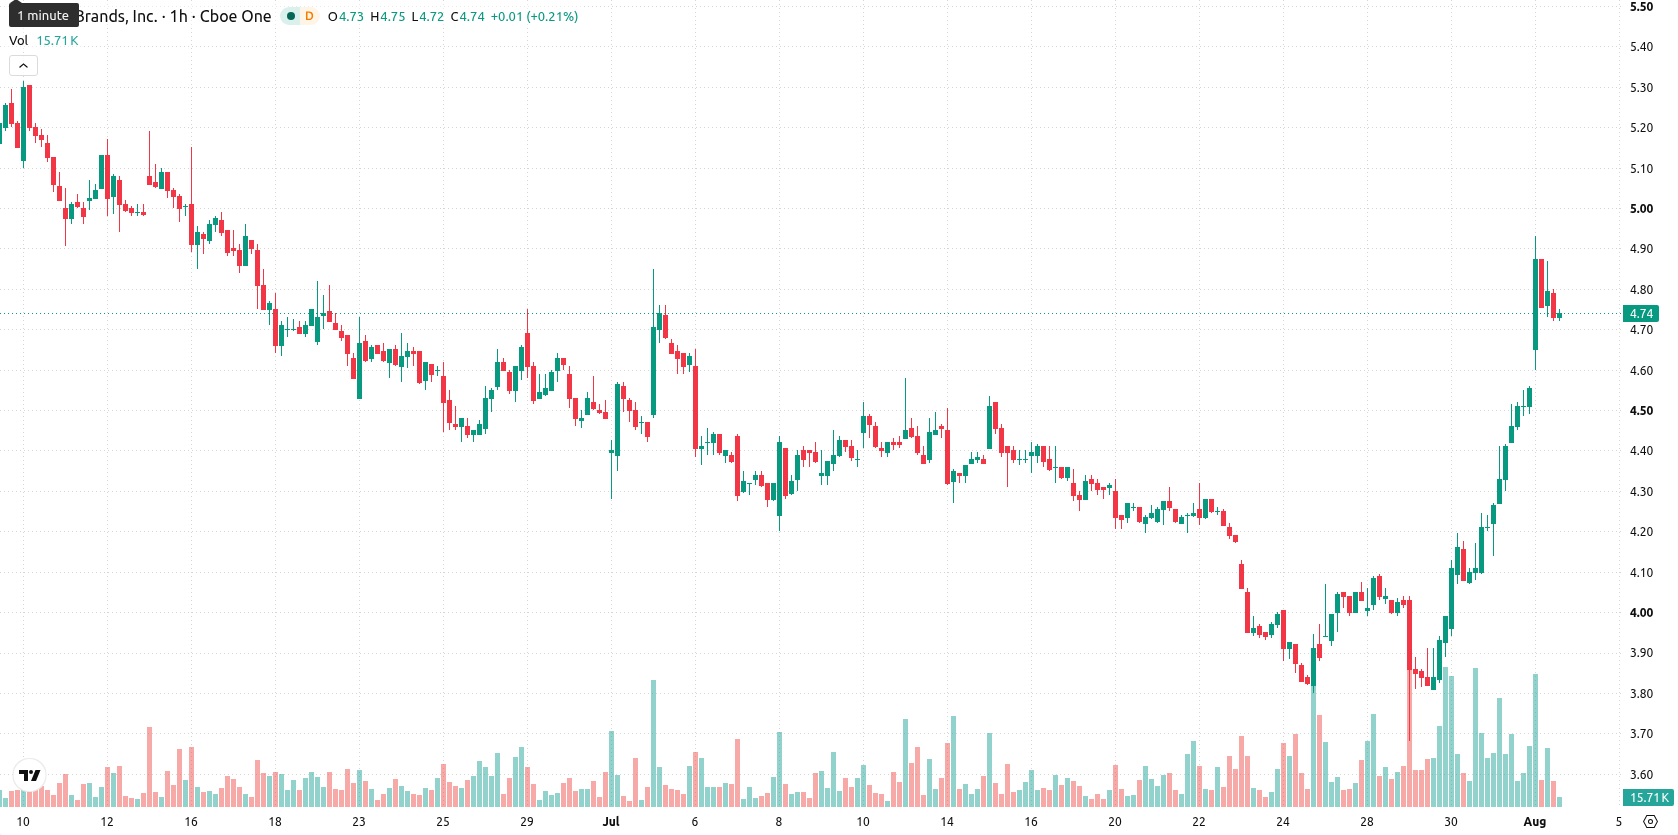
Tilray (TLRY) stock is trading at $4.72, reflecting a daily gain of 3.97%. The stock currently holds above its key short- and medium-term moving averages on the hourly chart, indicating a constructive near-term setup.
 2.93
3.00
Highlights
- Tilray delivered record fiscal Q2 revenues with narrowing losses, reflecting operational improvements and growing demand.
- Earnings per share were $0.05, missing the $0.21 estimate and signaling ongoing profitability concerns despite revenue gains.
- Short- and medium-term technical momentum is bullish, with TLRY expected to trade between $4.32 and $5.16 over the next few days.
Renewed buying interest as strong revenue offsets EPS miss
Tilray's recent fiscal Q2 results for the period ending May 31, 2026, revealed record revenues alongside narrowing losses, highlighting operational improvements and strengthening its business outlook, according to Wealthawesome. This growth in revenue underpins renewed buyer interest by signaling expanding demand and better efficiency. However, the company reported earnings per share of $0.05 for the quarter, falling short of the $0.21 consensus estimate, which introduces some caution on profitability. Overall, a strong sales trajectory and reduced losses have shaped the current positive sentiment despite the EPS miss.
Bullish momentum as technicals signal both strength and overbought risk
On the hourly chart, TLRY is trading above the MA-20 at $4.35 and the MA-50 at $4.11, with the long-term MA-200 overhead at $7.76. Immediate support is established by the Ichimoku Kijun level at $4.31. Momentum indicators reflect strong intraday buying: MACD and ADX both confirm a bullish tone, while Bull/Bear Power and the Awesome Oscillator also support buyer dominance. Oscillators paint an overbought picture, with RSI elevated at 80.85 and both CCI and Stochastic RSI in overbought territory, signaling stretched conditions and a watch for possible short-term reversals.
Higher upside probability as volatility band shapes near-term scenarios
For the next two to three trading days, the expected volatility band is $4.32 to $5.16. Statistical probabilities favor further upside, estimated at 79%, while the likelihood of a downward move is lower. The primary scenario projects TLRY consolidating within this corridor; a clear break above resistance could see the stock test the upper end of the range, while a drop below immediate support would increase the risk of deeper retracement.
Earlier, analysts noted that Tilray was exhibiting improving short-term momentum and sentiment, driven by revenue growth but tempered by persistent concerns around profitability. The latest results and continued technical strength reinforce the bullish undertone, but with oscillators signaling overbought conditions, traders should closely monitor for a potential reversal if support near $4.31 is breached.






Latest Tilray Brands News



-
 Afghanistan
-
 Albania
-
 Algeria
-
 Angola
-
 Argentina
-
 Armenia
-
 Australia
-
 Austria
-
 Azerbaijan
-
 Bahamas
-
 Bahrain
-
 Bangladesh
-
 Belarus
-
 Belgium
-
 Bolivia
-
 Botswana
-
 Brazil
-
 Brunei
-
 Bulgaria
-
 Cambodia
-
 Cameroon
-
 Canada
-
 Chile
-
 China
-
 Colombia
-
 Congo
-
 Costa Rica
-
 Cote d'Ivoire
-
 Croatia
-
 Cuba
-
 Cyprus
-
 Czechia
-
 DR Congo
-
 Denmark
-
 Dominican Republic
-
 Ecuador
-
 Egypt
-
 El Salvador
-
 Estonia
-
 Eswatini
-
 Ethiopia
-
 Finland
-
 France
-
 Georgia
-
 Germany
-
 Ghana
-
 Greece
-
 Haiti
-
 Hong Kong
-
 Hungary
-
 India
-
 Indonesia
-
 Iran, Islamic republic
-
 Iraq
-
 Ireland
-
 Israel
-
 Italy
-
 Jamaica
-
 Japan
-
 Jordan
-
 Kazakhstan
-
 Kenya
-
 Korea
-
 Kuwait
-
 Kyrgyzstan
-
 Laos
-
 Latvia
-
 Lebanon
-
 Lesotho
-
 Libya
-
 Lithuania
-
 Luxembourg
-
 Madagascar
-
 Malaysia
-
 Malta
-
 Mauritius
-
 Mexico
-
 Moldova
-
 Mongolia
-
 Montenegro
-
 Morocco
-
 Mozambique
-
 Myanmar
-
 Namibia
-
 Nepal
-
 Netherlands
-
 New Zealand
-
 Nigeria
-
 North Macedonia
-
 Norway
-
 Oman
-
 Pakistan
-
 Palestine
-
 Panama
-
 Papua New Guinea
-
 Paraguay
-
 Peru
-
 Philippines
-
 Poland
-
 Portugal
-
 Puerto Rico
-
 Qatar
-
 Reunion
-
 Romania
-
 Rwanda
-
 Saudi Arabia
-
 Serbia
-
 Singapore
-
 Slovakia
-
 Slovenia
-
 Somalia
-
 South Africa
-
 Spain
-
 Sri Lanka
-
 Sweden
-
 Switzerland
-
 Syria
-
 Taiwan
-
 Tajikistan
-
 Tanzania
-
 Thailand
-
 Trinidad and Tobago
-
 Tunisia
-
 Turkey
-
 UAE
-
 Uganda
-
 Ukraine
-
 United Kingdom
-
United States
-
 Uruguay
-
 Uzbekistan
-
 Venezuela
-
 Vietnam
-
 Yemen
-
 Zambia
-
 Zimbabwe
- Forex
- Crypto












