

DXCM slides nearly 5% as price action contradicts overbought momentum signals

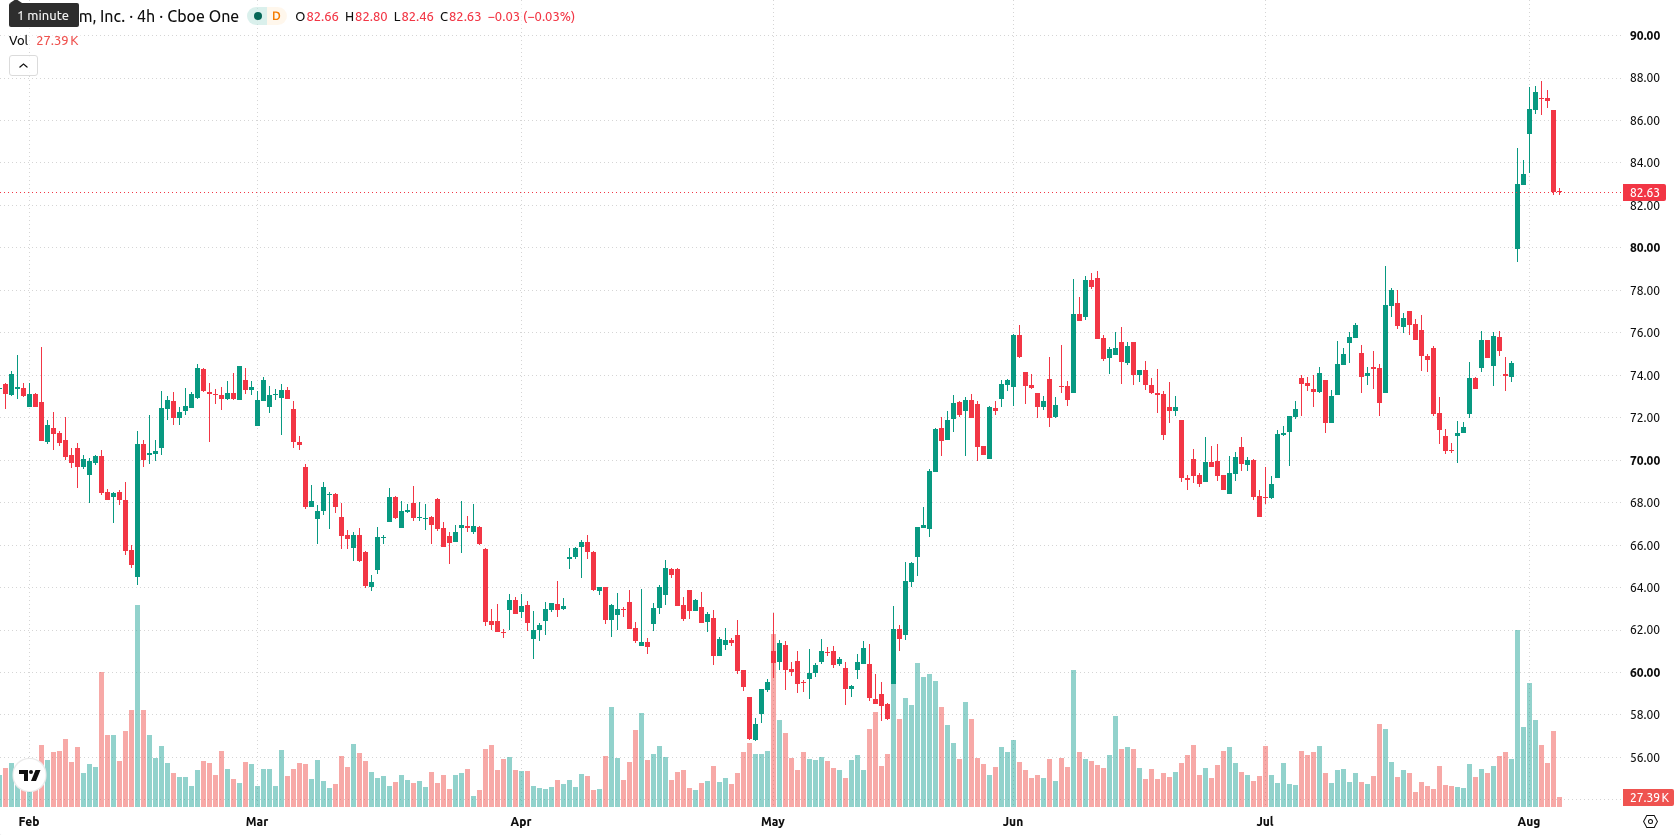
DexCom Inc (DXCM) dropped 4.82% after opening lower, with selling pressure outweighing a backdrop of strong quarterly results and recent regulatory advancements. The decline contradicts the stock’s short-, medium-, and long-term bullish technical structure, as DXCM continues to trade above its 20-day, 50-day, and 200-day moving averages.
 82.85
90.05
Highlights
- DexCom reported second quarter revenue of $1.31 billion, with improved margins fueled by international growth and broader G7 adoption.
- Management aims to convert nearly half of the U.S. customer base to the G7 15-day sensor by year-end, recently securing Health Canada clearance.
- DexCom stock remains under selling pressure despite bullish momentum signals, trading near support at $82.48 with a five-day expected range of $75.45 to $90.06.
Margin expansion and G7 rollout as institutions cut exposure
DexCom, Inc. reported revenue of $1.31 billion for the second quarter of 2026, with positive net margin and margin expansion driven by international growth. The company advanced adoption of its G7 15-day continuous glucose monitoring system, targeting nearly half of its U.S. customer base for conversion by year-end, and obtained Health Canada clearance for the G7 15-day system. Director Mark Foletta sold 2,000 shares on July 31, 2026. Rathbones Group PLC significantly reduced its holdings in DexCom during the first quarter, though price action has remained under broader selling pressure.
Bullish trend persists as momentum signals diverge sharply
DexCom is trading above its 20-day, 50-day, and 200-day moving averages ($75.97, $73.75, and $67.96 respectively), reinforcing its bullish structure across short-, medium-, and long-term trends. Immediate support and resistance for the stock are defined by today's low and high, at $82.48 and $85.23. Momentum signals are mixed. The MACD and RSI both indicate buying momentum, with the RSI at 71.68 signaling overbought conditions. The Stochastic RSI, CCI, and Bull/Bear Power all read strongly overbought. Bull/Bear Power, at 9.48, confirms buyers dominate intraday momentum. The Awesome Oscillator signals buying as well, but the ADX at 17.37 is neutral, indicating trend strength is weak. The Hull Moving Average suggests a sell, reflecting divergence among oscillators and trend tools. DexCom last traded at $82.75, dropping $4.19 or 4.82% today following a downside gap of approximately $1.71 (1.97%) at the open. The price is near the session's low, with intraday volatility at 3.33%, reflecting clear downward pressure after the open that contradicts overbought momentum signals.
Previously it was reported that DexCom was experiencing mixed momentum and technical signals amid strong business performance, with near-term volatility challenging its longer-term growth trend. The current article adds a new dimension by highlighting that, despite continued bullish alignment across major moving averages and positive momentum indicators, traders should closely monitor the $82.48 level as a potential pivot point for directional moves in the near term.






Latest DexCom Inc News


-
 Afghanistan
-
 Albania
-
 Algeria
-
 Angola
-
 Argentina
-
 Armenia
-
 Australia
-
 Austria
-
 Azerbaijan
-
 Bahamas
-
 Bahrain
-
 Bangladesh
-
 Belarus
-
 Belgium
-
 Bolivia
-
 Botswana
-
 Brazil
-
 Brunei
-
 Bulgaria
-
 Cambodia
-
 Cameroon
-
 Canada
-
 Chile
-
 China
-
 Colombia
-
 Congo
-
 Costa Rica
-
 Cote d'Ivoire
-
 Croatia
-
 Cuba
-
 Cyprus
-
 Czechia
-
 DR Congo
-
 Denmark
-
 Dominican Republic
-
 Ecuador
-
 Egypt
-
 El Salvador
-
 Estonia
-
 Eswatini
-
 Ethiopia
-
 Finland
-
 France
-
 Georgia
-
 Germany
-
 Ghana
-
 Greece
-
 Haiti
-
 Hong Kong
-
 Hungary
-
 India
-
 Indonesia
-
 Iran, Islamic republic
-
 Iraq
-
 Ireland
-
 Israel
-
 Italy
-
 Jamaica
-
 Japan
-
 Jordan
-
 Kazakhstan
-
 Kenya
-
 Korea
-
 Kuwait
-
 Kyrgyzstan
-
 Laos
-
 Latvia
-
 Lebanon
-
 Lesotho
-
 Libya
-
 Lithuania
-
 Luxembourg
-
 Madagascar
-
 Malaysia
-
 Malta
-
 Mauritius
-
 Mexico
-
 Moldova
-
 Mongolia
-
 Montenegro
-
 Morocco
-
 Mozambique
-
 Myanmar
-
 Namibia
-
 Nepal
-
 Netherlands
-
 New Zealand
-
 Nigeria
-
 North Macedonia
-
 Norway
-
 Oman
-
 Pakistan
-
 Palestine
-
 Panama
-
 Papua New Guinea
-
 Paraguay
-
 Peru
-
 Philippines
-
 Poland
-
 Portugal
-
 Puerto Rico
-
 Qatar
-
 Reunion
-
 Romania
-
 Rwanda
-
 Saudi Arabia
-
 Serbia
-
 Singapore
-
 Slovakia
-
 Slovenia
-
 Somalia
-
 South Africa
-
 Spain
-
 Sri Lanka
-
 Sweden
-
 Switzerland
-
 Syria
-
 Taiwan
-
 Tajikistan
-
 Tanzania
-
 Thailand
-
 Trinidad and Tobago
-
 Tunisia
-
 Turkey
-
 UAE
-
 Uganda
-
 Ukraine
-
 United Kingdom
-
United States
-
 Uruguay
-
 Uzbekistan
-
 Venezuela
-
 Vietnam
-
 Yemen
-
 Zambia
-
 Zimbabwe
- Forex
- Crypto












