

Lennar shares drop almost 4% after bearish outlook and technical pressures

Lennar Corporation (LEN) fell 3.81% after investors weighed the risk of lower earnings per share and revenue expected in the upcoming earnings release. The move is underscored by a bearish technical structure, with Lennar remaining below its 50- and 200-day moving averages and seller pressure capping upside attempts.
 93.89
91.77
Highlights
- Lennar is set to report lower earnings per share and revenue, with investors reassessing risk and valuation ahead of results.
- Despite a 16.5% year-to-date share price gain, shares suffered a 26.08% decline in one-year total shareholder return.
- Lennar stock consolidates between $81.5 and $87.58, with mixed momentum and overbought conditions limiting clear near-term trend direction.
Market revalues Lennar amid earnings uncertainty and recent performance reversal
Lennar is approaching its earnings announcement, with expectations for lower earnings per share and revenue reported. The company recorded a 16.5% year-to-date share price return, but a 26.08% decline in one-year total shareholder return was also noted. The market was seen reassessing Lennar's earnings risks and valuation ahead of the results, though price action has remained under broader selling pressure.
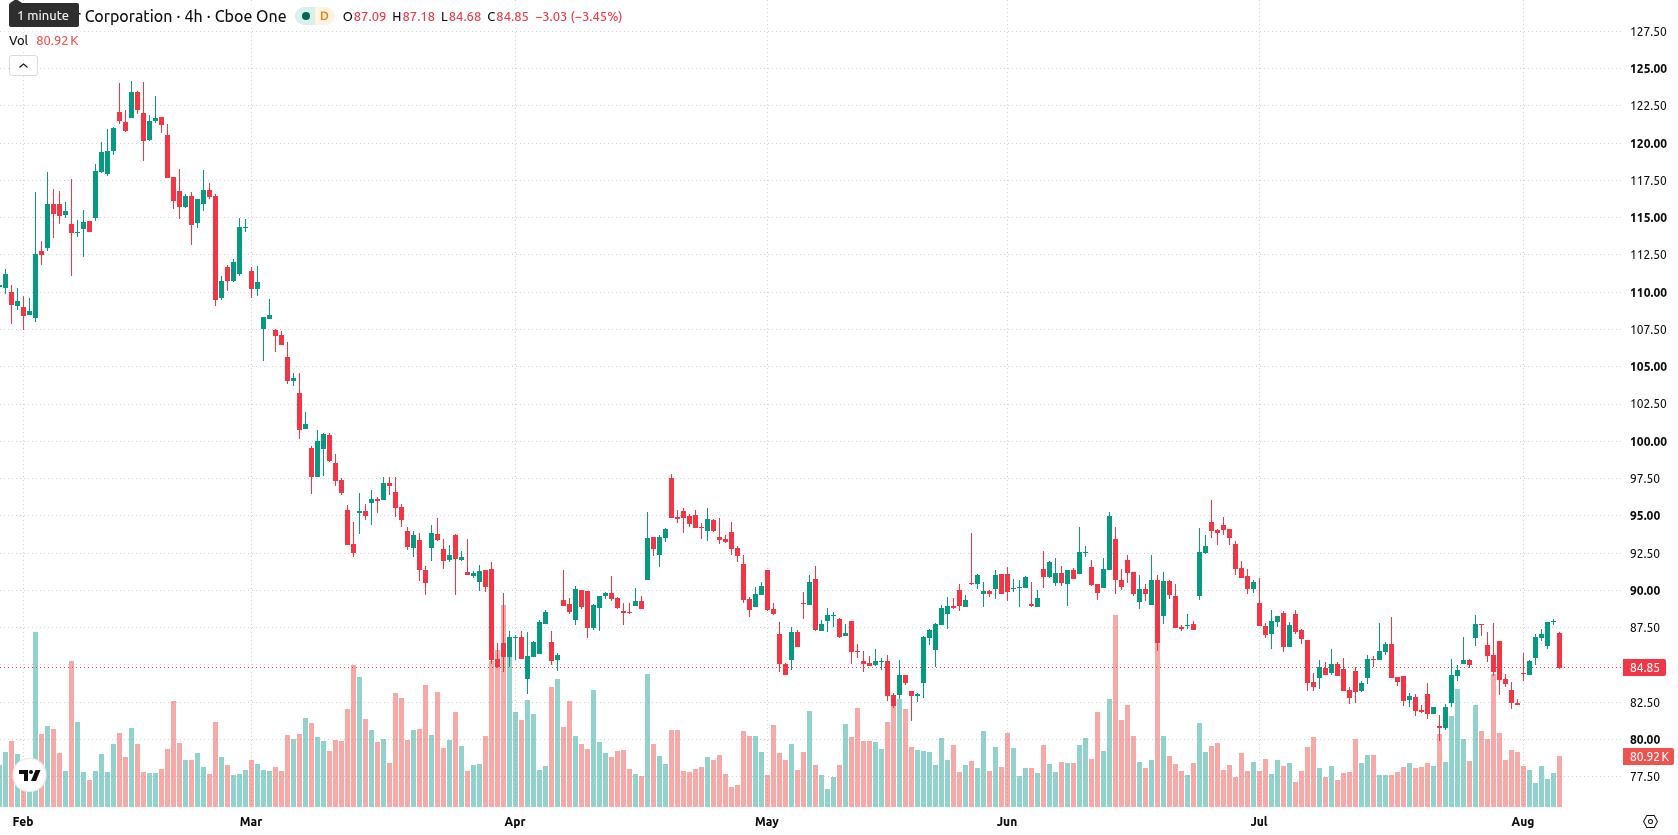
Mixed momentum and overbought signals as sellers cap medium-term recovery
Lennar is trading above its 20-day moving average (MA-20) at $84.39, but remains below both its 50-day (MA-50) at $87.69 and 200-day (MA-200) at $102.54. This setup points to short-term stabilization, though medium- and long-term trends show continued pressure from sellers, with the MA-50 below the MA-200 confirming a bearish alignment. The near-term floor is set at $84.39, while the immediate resistance is the recent low at $84.67. The Ichimoku Kijun at $85.61 also acts as overhead resistance. Momentum readings are mixed: the MACD signals strong sell momentum, though the Average Directional Index (ADX) remains neutral, highlighting a lack of clear trend strength. The Relative Strength Index (RSI) is at 55.38 with a buy forecast, and the Commodity Channel Index (CCI), Stochastic RSI, and Bull/Bear Power (BBP) all flag overbought conditions; buyers currently dominate intraday flows with BBP at 2.77. The Awesome Oscillator is neutral, not clearly supporting any directional move. The stock is down $3.35, slipping 3.81% so far, after opening with a downside gap of about $0.94 or 1.07%. It trades near today’s low, with intraday volatility at 2.96%. The tone remains pressured after the open, with oscillators suggesting overbought conditions and momentum indicators pointing to conflicting signals.
Earlier, analysts noted that Lennar continued to face unresolved technical resistance and a cautious trading outlook. The current article strengthens this view with mixed momentum signals and confirms that the prevailing scenario is range-bound consolidation, with key levels at $81.5 and $87.58 as immediate reference points for traders.









-
 Afghanistan
-
 Albania
-
 Algeria
-
 Angola
-
 Argentina
-
 Armenia
-
 Australia
-
 Austria
-
 Azerbaijan
-
 Bahamas
-
 Bahrain
-
 Bangladesh
-
 Belarus
-
 Belgium
-
 Bolivia
-
 Botswana
-
 Brazil
-
 Brunei
-
 Bulgaria
-
 Cambodia
-
 Cameroon
-
 Canada
-
 Chile
-
 China
-
 Colombia
-
 Congo
-
 Costa Rica
-
 Cote d'Ivoire
-
 Croatia
-
 Cuba
-
 Cyprus
-
 Czechia
-
 DR Congo
-
 Denmark
-
 Dominican Republic
-
 Ecuador
-
 Egypt
-
 El Salvador
-
 Estonia
-
 Eswatini
-
 Ethiopia
-
 Finland
-
 France
-
 Georgia
-
 Germany
-
 Ghana
-
 Greece
-
 Haiti
-
 Hong Kong
-
 Hungary
-
 India
-
 Indonesia
-
 Iran, Islamic republic
-
 Iraq
-
 Ireland
-
 Israel
-
 Italy
-
 Jamaica
-
 Japan
-
 Jordan
-
 Kazakhstan
-
 Kenya
-
 Korea
-
 Kuwait
-
 Kyrgyzstan
-
 Laos
-
 Latvia
-
 Lebanon
-
 Lesotho
-
 Libya
-
 Lithuania
-
 Luxembourg
-
 Madagascar
-
 Malaysia
-
 Malta
-
 Mauritius
-
 Mexico
-
 Moldova
-
 Mongolia
-
 Montenegro
-
 Morocco
-
 Mozambique
-
 Myanmar
-
 Namibia
-
 Nepal
-
 Netherlands
-
 New Zealand
-
 Nigeria
-
 North Macedonia
-
 Norway
-
 Oman
-
 Pakistan
-
 Palestine
-
 Panama
-
 Papua New Guinea
-
 Paraguay
-
 Peru
-
 Philippines
-
 Poland
-
 Portugal
-
 Puerto Rico
-
 Qatar
-
 Reunion
-
 Romania
-
 Rwanda
-
 Saudi Arabia
-
 Serbia
-
 Singapore
-
 Slovakia
-
 Slovenia
-
 Somalia
-
 South Africa
-
 Spain
-
 Sri Lanka
-
 Sweden
-
 Switzerland
-
 Syria
-
 Taiwan
-
 Tajikistan
-
 Tanzania
-
 Thailand
-
 Trinidad and Tobago
-
 Tunisia
-
 Turkey
-
 UAE
-
 Uganda
-
 Ukraine
-
 United Kingdom
-
United States
-
 Uruguay
-
 Uzbekistan
-
 Venezuela
-
 Vietnam
-
 Yemen
-
 Zambia
-
 Zimbabwe
- Forex
- Crypto












