

Will Netflix stock avoid deeper losses after Tiger Global exit news?

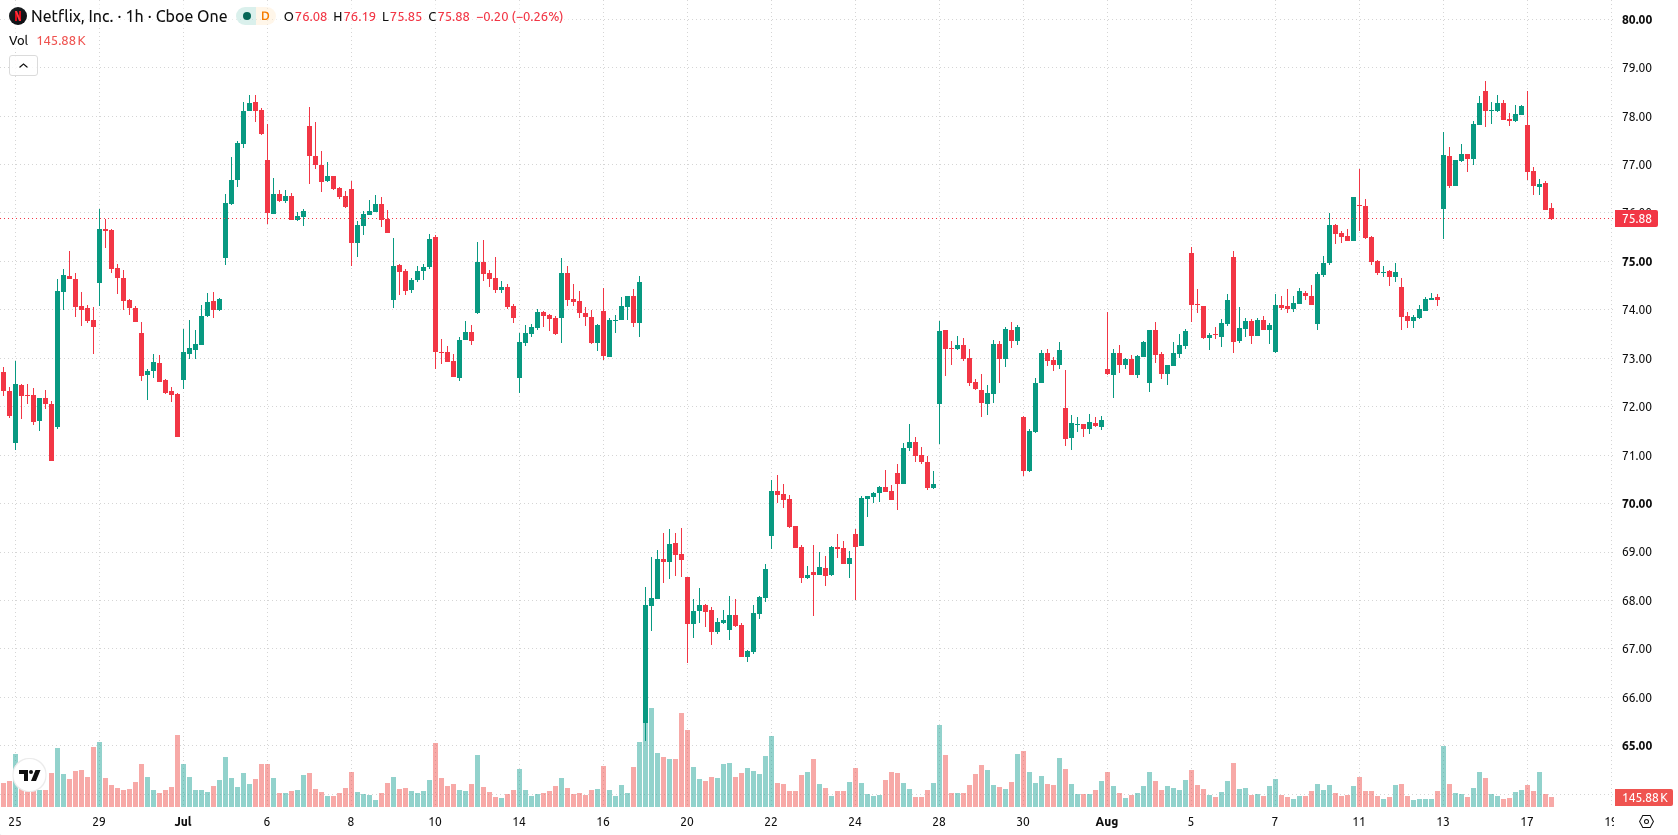
Netflix (NFLX) stock is trading at $75.6, down 3.26% on the day with a notable gap lower and finishing near session lows. The price remains below both its short- and medium-term moving averages, signaling persistent pressure in the current environment.
 64.11
66.78
Highlights
- Netflix executed a record $4.7 billion buyback in Q2 2026 and retains approval for up to $27 billion more in repurchases.
- Institutional activity was mixed with Pershing Square acquiring 3.15 million shares as Tiger Global Management exited its 2.44 million share position.
- Netflix stock trades below major moving averages and closed at $75.6, with a projected range of $73.43 to $77.77 and short-term downside pressure but a 64% probability of upward movement.
Share buybacks and mixed funds flows shape shareholder returns under selling pressure
Netflix executed a record $4.7 billion share buyback in the second quarter of 2026, directly lowering its outstanding share float and emphasizing its approach to capital returns, according to Thestreet and Techtimes. While institutional demand was highlighted by Pershing Square Capital Management acquiring a 3.15 million-share stake in the same period, Tiger Global Management’s full exit of 2.44 million shares during the quarter demonstrated mixed institutional flows, as reported by Techtimes. Additional corporate activity includes $9.9 billion in aggregate repurchases over the past twelve months and continued authorization for up to $27 billion more, alongside a modest 2% year-over-year rise in global view hours in the first half of 2026, as noted by Thestreet and Benzinga. These developments establish a backdrop of continued shareholder returns and evolving institutional positioning, though price action has remained under broader selling pressure.
Conflicting momentum signals as NFLX remains below key technical levels
Technically, NFLX/USD is positioned below its MA-20 and MA-50 on the hourly chart, while also remaining beneath the MA-200 on the daily timeframe. Immediate upside resistance is defined by the Ichimoku Kijun level at $76.15. On the momentum front, MACD shows a Strong Buy signal and ADX indicates a Buy, contrasting with RSI and CCI both pointing to Sell readings; Stochastic RSI is oversold, and Bull/Bear Power is also oversold, implying sellers dominate the recent intraday action. Awesome Oscillator is neutral, highlighting uncertainty and a lack of directional conviction in near-term price action.
Consolidation favored as rebound odds rise within established volatility range
Looking ahead, the next few sessions are projected to see NFLX/USD trade within a $73.43 to $77.77 range, reflecting typical volatility relative to current levels. With a 64% probability assigned to a price rebound, consolidation between support and resistance is the baseline expectation. A move above $76.15 would open a bullish scenario, while a drop below $73.43 may trigger further downside risk.
Earlier, analysts noted that Netflix’s stock was driven by institutional activity and significant corporate updates such as Pershing Square’s stake and ongoing share repurchases. With recent technical signals presenting a mixed outlook amid persistent selling pressure, traders should closely monitor a sustained move above the $76.15 resistance or below $73.43 support as a trigger for the next directional move.






Latest Netflix News




-
 Afghanistan
-
 Albania
-
 Algeria
-
 Angola
-
 Argentina
-
 Armenia
-
 Australia
-
 Austria
-
 Azerbaijan
-
 Bahamas
-
 Bahrain
-
 Bangladesh
-
 Belarus
-
 Belgium
-
 Bolivia
-
 Botswana
-
 Brazil
-
 Brunei
-
 Bulgaria
-
 Cambodia
-
 Cameroon
-
 Canada
-
 Chile
-
 China
-
 Colombia
-
 Congo
-
 Costa Rica
-
 Cote d'Ivoire
-
 Croatia
-
 Cuba
-
 Cyprus
-
 Czechia
-
 DR Congo
-
 Denmark
-
 Dominican Republic
-
 Ecuador
-
 Egypt
-
 El Salvador
-
 Estonia
-
 Eswatini
-
 Ethiopia
-
 Finland
-
 France
-
 Georgia
-
 Germany
-
 Ghana
-
 Greece
-
 Haiti
-
 Hong Kong
-
 Hungary
-
 India
-
 Indonesia
-
 Iran, Islamic republic
-
 Iraq
-
 Ireland
-
 Israel
-
 Italy
-
 Jamaica
-
 Japan
-
 Jordan
-
 Kazakhstan
-
 Kenya
-
 Korea
-
 Kuwait
-
 Kyrgyzstan
-
 Laos
-
 Latvia
-
 Lebanon
-
 Lesotho
-
 Libya
-
 Lithuania
-
 Luxembourg
-
 Madagascar
-
 Malaysia
-
 Malta
-
 Mauritius
-
 Mexico
-
 Moldova
-
 Mongolia
-
 Montenegro
-
 Morocco
-
 Mozambique
-
 Myanmar
-
 Namibia
-
 Nepal
-
 Netherlands
-
 New Zealand
-
 Nigeria
-
 North Macedonia
-
 Norway
-
 Oman
-
 Pakistan
-
 Palestine
-
 Panama
-
 Papua New Guinea
-
 Paraguay
-
 Peru
-
 Philippines
-
 Poland
-
 Portugal
-
 Puerto Rico
-
 Qatar
-
 Reunion
-
 Romania
-
 Rwanda
-
 Saudi Arabia
-
 Serbia
-
 Singapore
-
 Slovakia
-
 Slovenia
-
 Somalia
-
 South Africa
-
 Spain
-
 Sri Lanka
-
 Sweden
-
 Switzerland
-
 Syria
-
 Taiwan
-
 Tajikistan
-
 Tanzania
-
 Thailand
-
 Trinidad and Tobago
-
 Tunisia
-
 Turkey
-
 UAE
-
 Uganda
-
 Ukraine
-
 United Kingdom
-
United States
-
 Uruguay
-
 Uzbekistan
-
 Venezuela
-
 Vietnam
-
 Yemen
-
 Zambia
-
 Zimbabwe
- Forex
- Crypto












