

Caterpillar shares approach key $805.68 support as RSI nears oversold territory: weekly analysis

Shares of Caterpillar, Inc. (CAT) are trading near $817 after a marked pullback of nearly 5% this week as downside momentum built into oversold territory. Technical signals point to stretched weakness, with support levels coming into focus as volatility remains elevated. The week ahead will hinge on whether buyers can defend these long-term support zones or if further downside pressure materializes.
 637.41
722.51
Highlights
- Shares of Caterpillar fell 4.6% over the past week to $817.33, trading near the bottom of the recent weekly range.
- The stock trades below key moving averages with MACD in strong sell territory and RSI approaching oversold, indicating downside momentum.
- In the coming week, Caterpillar shares are expected to consolidate between $805.68 and $848.47 with a 75% probability of further downside and risk extending to $761.11 if support fails.
Record results and profit-taking drive volatility following earnings rally
CAT reported record quarterly results, including its first $20 billion quarter and annual revenue of $67.59 billion with net profit of $8.88 billion, according to TradingKey and PR Newswire. Demand in core industrial segments and a 24% year-over-year revenue increase supported operations, while the company further expanded its $100 million manufacturing workforce initiative by committing $3 million to training programs in Arkansas, as detailed by PR Newswire. Recent share volatility was fueled by profit-taking after the earnings rally and ongoing scrutiny over power generation demand, according to TradingKey and Investing.com.
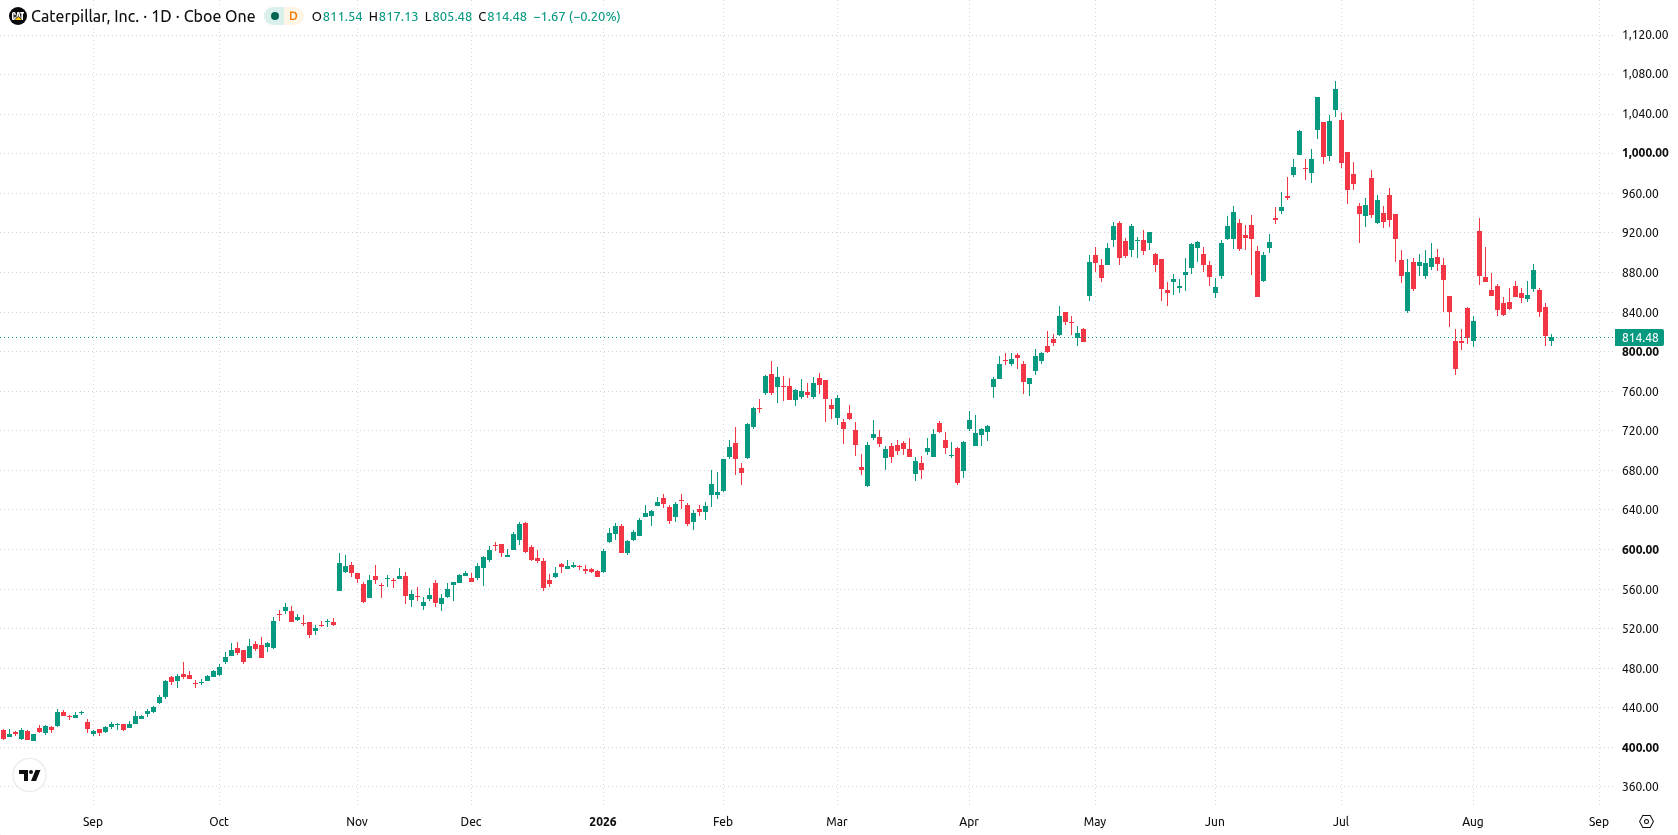
Technical weakness deepens as MACD sell signal and RSI approach extremes
On the daily chart, the setup is marked by a sharp move lower without a sustained trend, as reflected by volatility of 10.21%. MACD remains in strong sell territory, while the RSI at 39.62 is approaching oversold — signaling underlying downside momentum. Immediate support is found at $805.68, with resistance at $848.47 from the 20-day average and $857.29 at the Ichimoku Kijun, both acting as barriers to any rebound attempts.
Rangebound bias next week as downside risk outweighs rebound prospects
In the week ahead, Caterpillar shares are expected to trade within a range of $761.11 to $854.1. There is a 25% probability of an increase and a 75% chance of further downside. The base case is further consolidation between $805.68 and $848.47. A move above $848.47 could challenge the $857.29 resistance, while a slide below $805.68 opens up risk toward the lower boundary of $761.11.
Earlier, analysts noted that rising infrastructure investment and industrial demand were lifting key suppliers like Caterpillar alongside broader manufacturing beneficiaries. The latest technical setup suggests traders should monitor the $805.68 to $848.47 consolidation range, as a break on either side could define the next directional move.






Latest Caterpillar News




-
 Afghanistan
-
 Albania
-
 Algeria
-
 Angola
-
 Argentina
-
 Armenia
-
 Australia
-
 Austria
-
 Azerbaijan
-
 Bahamas
-
 Bahrain
-
 Bangladesh
-
 Belarus
-
 Belgium
-
 Bolivia
-
 Botswana
-
 Brazil
-
 Brunei
-
 Bulgaria
-
 Cambodia
-
 Cameroon
-
 Canada
-
 Chile
-
 China
-
 Colombia
-
 Congo
-
 Costa Rica
-
 Cote d'Ivoire
-
 Croatia
-
 Cuba
-
 Cyprus
-
 Czechia
-
 DR Congo
-
 Denmark
-
 Dominican Republic
-
 Ecuador
-
 Egypt
-
 El Salvador
-
 Estonia
-
 Eswatini
-
 Ethiopia
-
 Finland
-
 France
-
 Georgia
-
 Germany
-
 Ghana
-
 Greece
-
 Haiti
-
 Hong Kong
-
 Hungary
-
 India
-
 Indonesia
-
 Iran, Islamic republic
-
 Iraq
-
 Ireland
-
 Israel
-
 Italy
-
 Jamaica
-
 Japan
-
 Jordan
-
 Kazakhstan
-
 Kenya
-
 Korea
-
 Kuwait
-
 Kyrgyzstan
-
 Laos
-
 Latvia
-
 Lebanon
-
 Lesotho
-
 Libya
-
 Lithuania
-
 Luxembourg
-
 Madagascar
-
 Malaysia
-
 Malta
-
 Mauritius
-
 Mexico
-
 Moldova
-
 Mongolia
-
 Montenegro
-
 Morocco
-
 Mozambique
-
 Myanmar
-
 Namibia
-
 Nepal
-
 Netherlands
-
 New Zealand
-
 Nigeria
-
 North Macedonia
-
 Norway
-
 Oman
-
 Pakistan
-
 Palestine
-
 Panama
-
 Papua New Guinea
-
 Paraguay
-
 Peru
-
 Philippines
-
 Poland
-
 Portugal
-
 Puerto Rico
-
 Qatar
-
 Reunion
-
 Romania
-
 Rwanda
-
 Saudi Arabia
-
 Serbia
-
 Singapore
-
 Slovakia
-
 Slovenia
-
 Somalia
-
 South Africa
-
 Spain
-
 Sri Lanka
-
 Sweden
-
 Switzerland
-
 Syria
-
 Taiwan
-
 Tajikistan
-
 Tanzania
-
 Thailand
-
 Trinidad and Tobago
-
 Tunisia
-
 Turkey
-
 UAE
-
 Uganda
-
 Ukraine
-
 United Kingdom
-
United States
-
 Uruguay
-
 Uzbekistan
-
 Venezuela
-
 Vietnam
-
 Yemen
-
 Zambia
-
 Zimbabwe
- Forex
- Crypto












