

ServiceNow shares weekly forecast: Recovery holds but faces a stretched setup

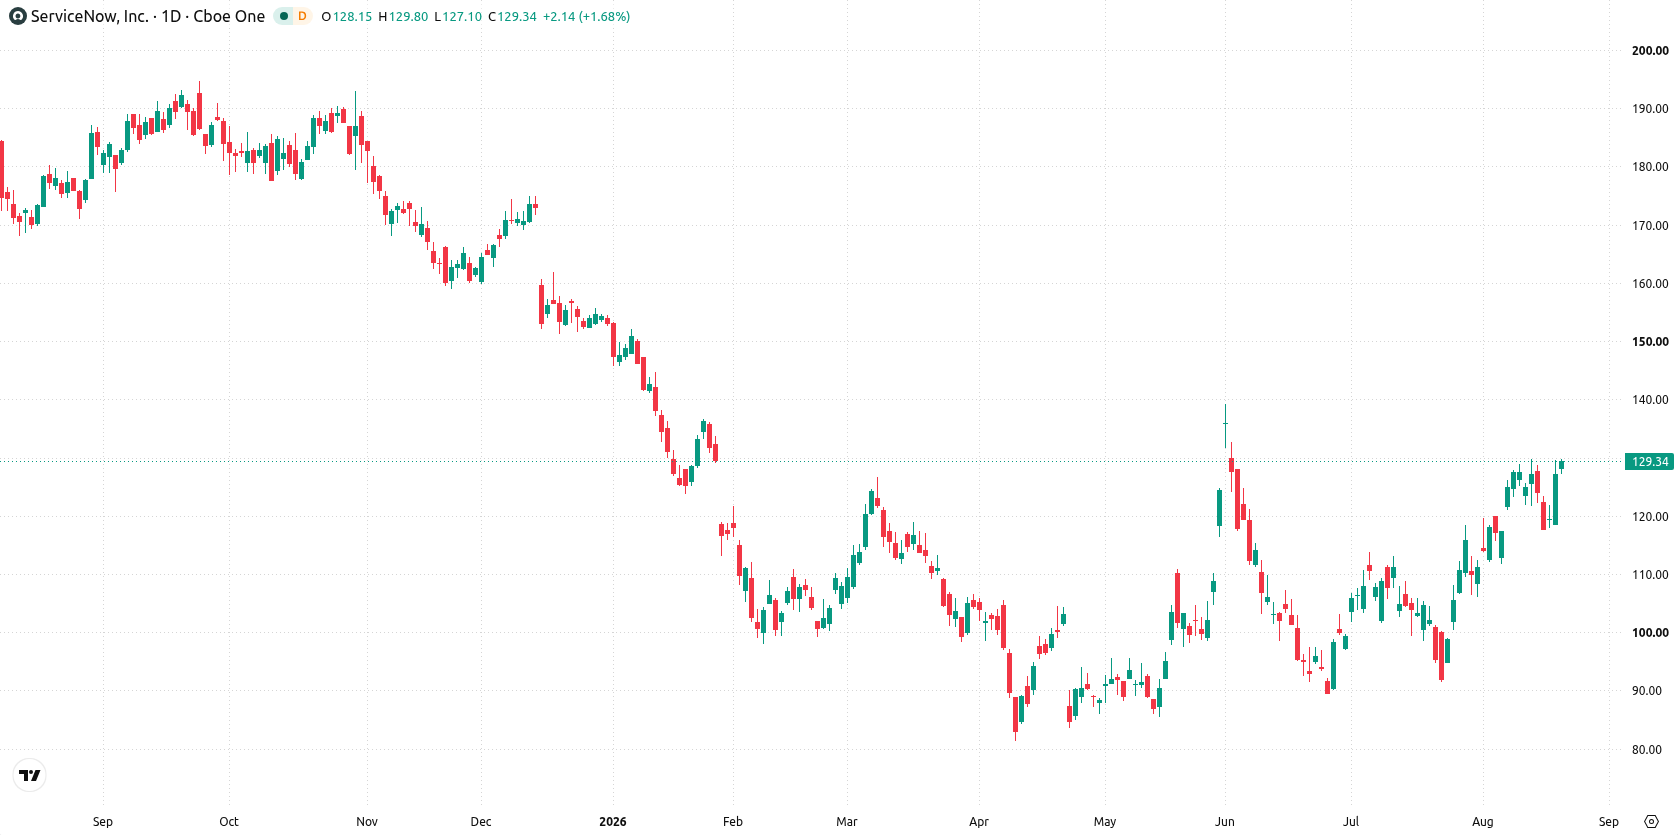
Shares of ServiceNow (NOW) are trading near $130 after rising around 4.5% this week as the recovery holds, but conditions appear stretched heading into the new week. Support remains key as bullish momentum faces resistance from overbought signals, highlighting the potential for consolidation or a pause in upside. Traders should watch for shifts in sentiment with recent gains entering a technically extended zone.
 103.78
112.20
Highlights
- Shares of ServiceNow rose 4.5% over the past week to $129.62, positioned at the top of their weekly trading range.
- The stock trades above all key daily moving averages with strong bullish momentum, but short-term indicators approach overbought conditions, suggesting potential for a pause or consolidation.
- Next week, expected range is $121.84 to $134.99, with high odds of further upside unless support at $129.6 fails.
Acquisition announcements and product launches propel bullish momentum this week
ServiceNow agreed to acquire cybersecurity firm Armis for $7.75 billion to expand its AI-driven security offerings and enhance its enterprise cyber defense platform, according to Yahoo Finance on August 17, 2026. This move follows a period of bullish sentiment after ServiceNow reported strong second-quarter results and announced new AI and cybersecurity products, as highlighted by Quiver Quantitative and GuruFocus. Additional drivers for NOW this week included recent insider activity and a partnership with Tribal to launch 'Tribal for ServiceNow' that integrates AI agents into its platform, as reported by HPCwire.
Momentum signals near overbought as volatility and support levels anchor gains
On the daily chart, the structure is defined by a sharp move higher without a sustained trend, with volatility over the past week at 10.21%. The MACD remains firmly bullish at 6.14, reinforcing upward momentum, while both RSI (62.19) and CCI (81.39) are approaching overbought territory, hinting at elevated optimism but not extreme levels yet. The price is sitting right on support at $129.6, which is derived from the weekly high, while the Ichimoku Kijun at $110.64 serves as an additional support level further below. With no immediate resistance overhead, recent gains may face a pause or consolidation as momentum matures.
Upside favored next week as consolidation and breakout risks intensify
Next week, the expected range for ServiceNow shares is $121.84 to $134.99. There is a very high probability of further upside and a very low probability of a decline. The base case calls for the stock to consolidate just above support at $129.6. A push through $134.99 would open the door to further gains, while a reversal below $129.6 would likely trigger a retest toward $121.84 as the next support.
Previously it was reported that ServiceNow exhibited continued bullish momentum even in the face of insider selling, with technical signals highlighting a potential for further gains but warning of overbought conditions. The current article extends this outlook by noting that despite the addition of significant M&A activity and new product integrations, traders should monitor the $134.99 level as a critical point for further upside or potential consolidation in the days ahead.






Latest ServiceNow News




-
 Afghanistan
-
 Albania
-
 Algeria
-
 Angola
-
 Argentina
-
 Armenia
-
 Australia
-
 Austria
-
 Azerbaijan
-
 Bahamas
-
 Bahrain
-
 Bangladesh
-
 Belarus
-
 Belgium
-
 Bolivia
-
 Botswana
-
 Brazil
-
 Brunei
-
 Bulgaria
-
 Cambodia
-
 Cameroon
-
 Canada
-
 Chile
-
 China
-
 Colombia
-
 Congo
-
 Costa Rica
-
 Cote d'Ivoire
-
 Croatia
-
 Cuba
-
 Cyprus
-
 Czechia
-
 DR Congo
-
 Denmark
-
 Dominican Republic
-
 Ecuador
-
 Egypt
-
 El Salvador
-
 Estonia
-
 Eswatini
-
 Ethiopia
-
 Finland
-
 France
-
 Georgia
-
 Germany
-
 Ghana
-
 Greece
-
 Haiti
-
 Hong Kong
-
 Hungary
-
 India
-
 Indonesia
-
 Iran, Islamic republic
-
 Iraq
-
 Ireland
-
 Israel
-
 Italy
-
 Jamaica
-
 Japan
-
 Jordan
-
 Kazakhstan
-
 Kenya
-
 Korea
-
 Kuwait
-
 Kyrgyzstan
-
 Laos
-
 Latvia
-
 Lebanon
-
 Lesotho
-
 Libya
-
 Lithuania
-
 Luxembourg
-
 Madagascar
-
 Malaysia
-
 Malta
-
 Mauritius
-
 Mexico
-
 Moldova
-
 Mongolia
-
 Montenegro
-
 Morocco
-
 Mozambique
-
 Myanmar
-
 Namibia
-
 Nepal
-
 Netherlands
-
 New Zealand
-
 Nigeria
-
 North Macedonia
-
 Norway
-
 Oman
-
 Pakistan
-
 Palestine
-
 Panama
-
 Papua New Guinea
-
 Paraguay
-
 Peru
-
 Philippines
-
 Poland
-
 Portugal
-
 Puerto Rico
-
 Qatar
-
 Reunion
-
 Romania
-
 Rwanda
-
 Saudi Arabia
-
 Serbia
-
 Singapore
-
 Slovakia
-
 Slovenia
-
 Somalia
-
 South Africa
-
 Spain
-
 Sri Lanka
-
 Sweden
-
 Switzerland
-
 Syria
-
 Taiwan
-
 Tajikistan
-
 Tanzania
-
 Thailand
-
 Trinidad and Tobago
-
 Tunisia
-
 Turkey
-
 UAE
-
 Uganda
-
 Ukraine
-
 United Kingdom
-
United States
-
 Uruguay
-
 Uzbekistan
-
 Venezuela
-
 Vietnam
-
 Yemen
-
 Zambia
-
 Zimbabwe
- Forex
- Crypto












