

Steel Dynamics stock breakout attempt: Upside targets to watch

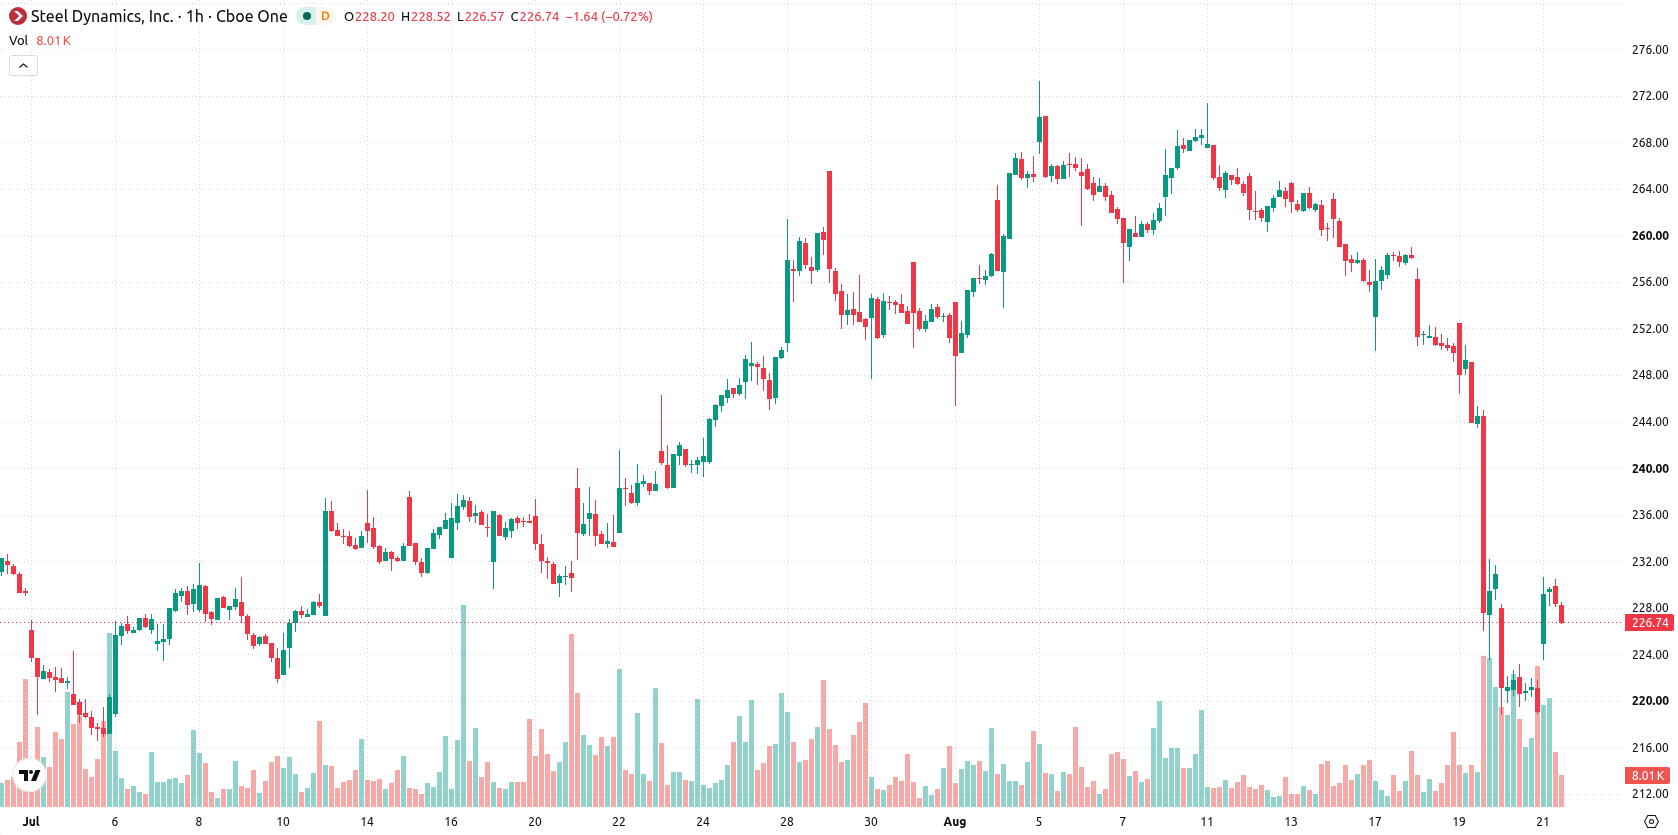
Steel Dynamics (STLD) stock is trading at $227.02, posting a gain of 3.66% on the day. The price currently sits below its key moving averages but remains above those tracking the longer-term trend.
 253.21
253.99
Highlights
- Shares of STLD trade below key short- and medium-term moving averages but remain above long-term support levels.
- Momentum indicators are predominantly bearish, with sellers dominating intraday activity and oscillators showing mixed signals.
- STLD is expected to consolidate between $208.68 to $245.36 over the next 2 to 3 days, with a 70% probability of further downside.
Bearish momentum persists as resistance levels cap recovery
STLD remains below the MA-20 at $231.73 and MA-50 at $247.73 on the H1 chart, while holding above the MA-200 at $205.79 on the daily timeframe. The Ichimoku Kijun at $238.91 marks immediate resistance. Momentum indicators are predominantly bearish: MACD is rated Strong Sell, ADX signals Sell, and RSI is weak at 37.15 (Sell). Stoch RSI points to overbought conditions, while Bull/Bear Power is in oversold territory, indicating sellers dominate intraday action. CCI and the Awesome Oscillator are both neutral, reflecting a degree of hesitation despite heightened volatility.
Sideways bias likely as probability favors further downside
For the next 2–3 trading days, STLD is expected to consolidate within a volatility band of $208.68 to $245.36. There is a 30% probability of continued upward movement versus a 70% chance for a move lower. The baseline outlook is for sideways price action in this range, with a break above $238.91 opening further upside potential, while a fall below $208.68 may trigger additional downside and test recent long-term supports.
Earlier, analysts noted that Steel Dynamics was under sustained technical pressure as the broader steel sector experienced persistent weakness. The current analysis reinforces this bearish outlook, highlighting the importance of monitoring $208.68 as a key support level that could signal further downside risk if breached.






Latest Steel Dynamics Inc News


-
 Afghanistan
-
 Albania
-
 Algeria
-
 Angola
-
 Argentina
-
 Armenia
-
 Australia
-
 Austria
-
 Azerbaijan
-
 Bahamas
-
 Bahrain
-
 Bangladesh
-
 Belarus
-
 Belgium
-
 Bolivia
-
 Botswana
-
 Brazil
-
 Brunei
-
 Bulgaria
-
 Cambodia
-
 Cameroon
-
 Canada
-
 Chile
-
 China
-
 Colombia
-
 Congo
-
 Costa Rica
-
 Cote d'Ivoire
-
 Croatia
-
 Cuba
-
 Cyprus
-
 Czechia
-
 DR Congo
-
 Denmark
-
 Dominican Republic
-
 Ecuador
-
 Egypt
-
 El Salvador
-
 Estonia
-
 Eswatini
-
 Ethiopia
-
 Finland
-
 France
-
 Georgia
-
 Germany
-
 Ghana
-
 Greece
-
 Haiti
-
 Hong Kong
-
 Hungary
-
 India
-
 Indonesia
-
 Iran, Islamic republic
-
 Iraq
-
 Ireland
-
 Israel
-
 Italy
-
 Jamaica
-
 Japan
-
 Jordan
-
 Kazakhstan
-
 Kenya
-
 Korea
-
 Kuwait
-
 Kyrgyzstan
-
 Laos
-
 Latvia
-
 Lebanon
-
 Lesotho
-
 Libya
-
 Lithuania
-
 Luxembourg
-
 Madagascar
-
 Malaysia
-
 Malta
-
 Mauritius
-
 Mexico
-
 Moldova
-
 Mongolia
-
 Montenegro
-
 Morocco
-
 Mozambique
-
 Myanmar
-
 Namibia
-
 Nepal
-
 Netherlands
-
 New Zealand
-
 Nigeria
-
 North Macedonia
-
 Norway
-
 Oman
-
 Pakistan
-
 Palestine
-
 Panama
-
 Papua New Guinea
-
 Paraguay
-
 Peru
-
 Philippines
-
 Poland
-
 Portugal
-
 Puerto Rico
-
 Qatar
-
 Reunion
-
 Romania
-
 Rwanda
-
 Saudi Arabia
-
 Serbia
-
 Singapore
-
 Slovakia
-
 Slovenia
-
 Somalia
-
 South Africa
-
 Spain
-
 Sri Lanka
-
 Sweden
-
 Switzerland
-
 Syria
-
 Taiwan
-
 Tajikistan
-
 Tanzania
-
 Thailand
-
 Trinidad and Tobago
-
 Tunisia
-
 Turkey
-
 UAE
-
 Uganda
-
 Ukraine
-
 United Kingdom
-
United States
-
 Uruguay
-
 Uzbekistan
-
 Venezuela
-
 Vietnam
-
 Yemen
-
 Zambia
-
 Zimbabwe
- Forex
- Crypto












