

Full-year revenue and earnings guidance raised: CRM resistance levels in focus

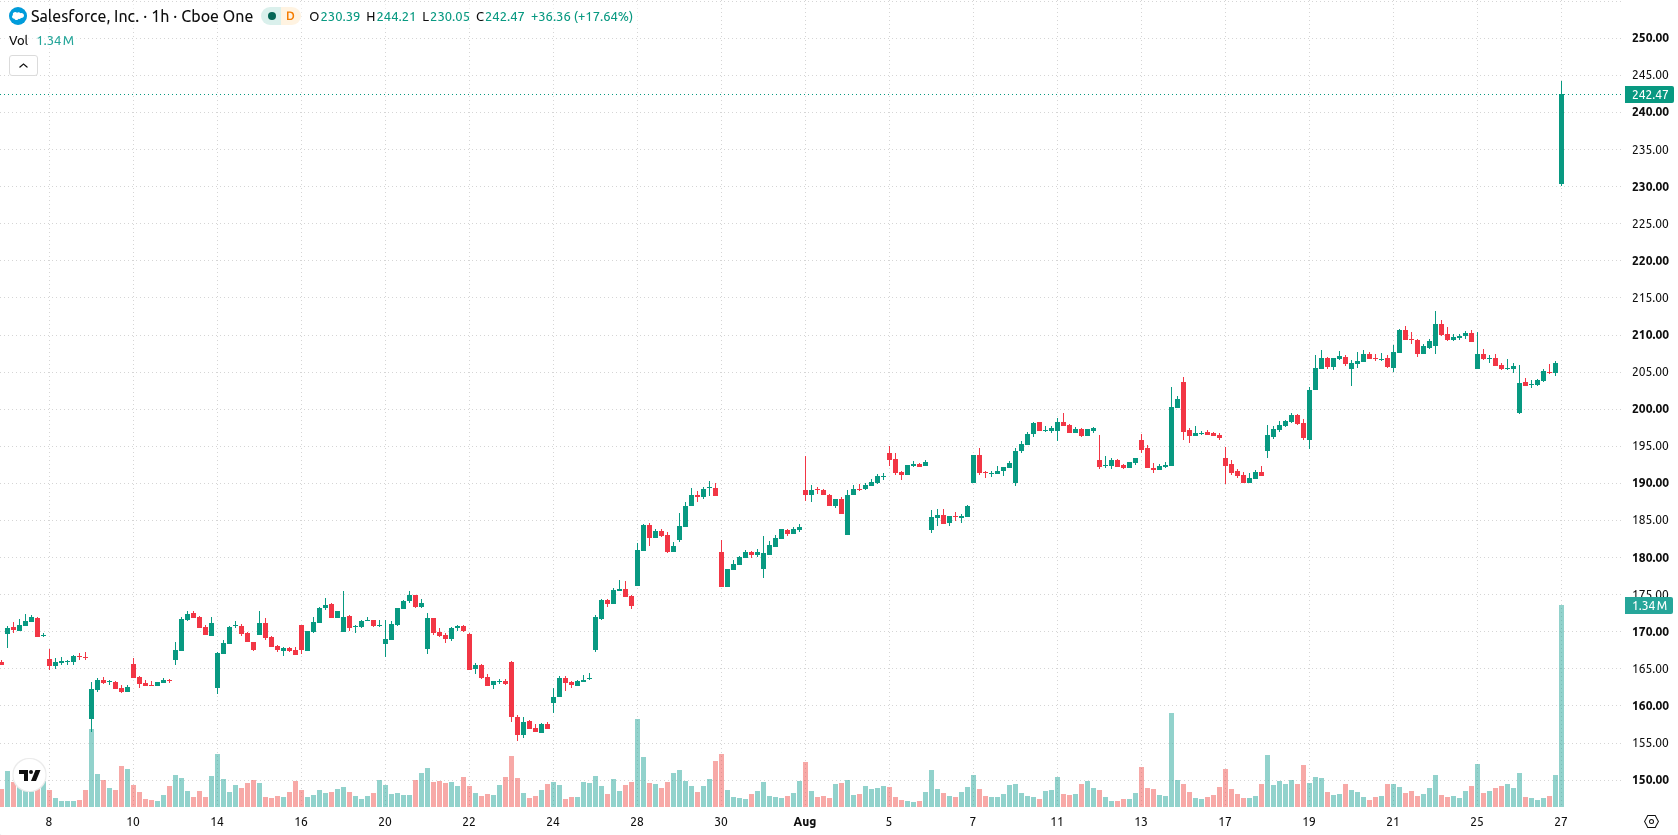
Salesforce (CRM) stock is trading at $244.13, up 18.73% on the day, with the move placing it well above its key moving averages. The price stands out for marking a strong position relative to recent and long-term average levels.
 216.77
234.21
Highlights
- Salesforce stock rose after the company announced second-quarter fiscal 2027 revenue of $11.35 billion, an 11% year-over-year increase above guidance.
- Salesforce partnered with Anthropic to offer Claudeforce, integrating Claude AI with CRM data for automated sales tasks.
- Shares of Salesforce surged 18.73% to $244.13 and are expected to trade between $237.77 and $250.49 with overbought technical signals and high volatility.
Investor optimism as revenue, outlook, and AI deals boost sentiment
The current rally in Salesforce follows its fiscal 2027 second-quarter revenue announcement of $11.35 billion, an 11% year-over-year increase that surpassed constant-currency guidance, according to Themarketsdaily. This outperformance reflects strong operational execution and has prompted renewed investor buying interest. Alongside earnings, Salesforce expanded its partnership with Anthropic by launching Claudeforce, a new solution integrating Claude AI with Salesforce CRM data for automated sales tasks, as reported by Qz. Additionally, the company raised its full-year revenue and earnings per share guidance and provided strong third-quarter projections, as noted by Cnbc, further supporting market optimism around future growth.
Mixed oscillator signals as resistance nears and divergence grows
CRM is positioned above its MA-20 ($206.61) and MA-50 ($205.68) on the H1 chart, and sits well above the long-term MA-200 at $200.34 on the daily timeframe. The Ichimoku Kijun at $206.06 marks immediate support. Resistance is approaching near $250.49, with support reinforced at the $206.06–$206.61 corridor. Oscillator readings are mixed: RSI indicates buy conditions, while Stoch RSI and Bull/Bear Power remain in overbought territory, suggesting short-term risk of reversal. MACD is in Sell, ADX and the Awesome Oscillator are Neutral, and CCI shows a neutral stance, highlighting divergence across momentum indicators despite recent price strength.
Consolidation range as bullish breakout probability dominates
In the short term, CRM is expected to consolidate between $237.77 and $250.49 over the next 2–3 trading days. The probability of an upward breakout currently stands at 78%, with a lower 22% chance of a downside move. Consolidation within this range represents the baseline scenario. A push above $250.49 would signal a bullish extension, while a drop below immediate support at $206.06 could set the stage for a corrective pullback.
Earlier, analysts noted that Salesforce's broader technical outlook remained bullish, cautioning that overbought signals could limit further gains. With fresh revenue upside and major product integration now driving price action, traders should monitor for a potential breakout above $250.49 as the next catalyst for directional momentum.






Latest Salesforce News





-
 Afghanistan
-
 Albania
-
 Algeria
-
 Angola
-
 Argentina
-
 Armenia
-
 Australia
-
 Austria
-
 Azerbaijan
-
 Bahamas
-
 Bahrain
-
 Bangladesh
-
 Belarus
-
 Belgium
-
 Bolivia
-
 Botswana
-
 Brazil
-
 Brunei
-
 Bulgaria
-
 Cambodia
-
 Cameroon
-
 Canada
-
 Chile
-
 China
-
 Colombia
-
 Congo
-
 Costa Rica
-
 Cote d'Ivoire
-
 Croatia
-
 Cuba
-
 Cyprus
-
 Czechia
-
 DR Congo
-
 Denmark
-
 Dominican Republic
-
 Ecuador
-
 Egypt
-
 El Salvador
-
 Estonia
-
 Eswatini
-
 Ethiopia
-
 Finland
-
 France
-
 Georgia
-
 Germany
-
 Ghana
-
 Greece
-
 Haiti
-
 Hong Kong
-
 Hungary
-
 India
-
 Indonesia
-
 Iran, Islamic republic
-
 Iraq
-
 Ireland
-
 Israel
-
 Italy
-
 Jamaica
-
 Japan
-
 Jordan
-
 Kazakhstan
-
 Kenya
-
 Korea
-
 Kuwait
-
 Kyrgyzstan
-
 Laos
-
 Latvia
-
 Lebanon
-
 Lesotho
-
 Libya
-
 Lithuania
-
 Luxembourg
-
 Madagascar
-
 Malaysia
-
 Malta
-
 Mauritius
-
 Mexico
-
 Moldova
-
 Mongolia
-
 Montenegro
-
 Morocco
-
 Mozambique
-
 Myanmar
-
 Namibia
-
 Nepal
-
 Netherlands
-
 New Zealand
-
 Nigeria
-
 North Macedonia
-
 Norway
-
 Oman
-
 Pakistan
-
 Palestine
-
 Panama
-
 Papua New Guinea
-
 Paraguay
-
 Peru
-
 Philippines
-
 Poland
-
 Portugal
-
 Puerto Rico
-
 Qatar
-
 Reunion
-
 Romania
-
 Rwanda
-
 Saudi Arabia
-
 Serbia
-
 Singapore
-
 Slovakia
-
 Slovenia
-
 Somalia
-
 South Africa
-
 Spain
-
 Sri Lanka
-
 Sweden
-
 Switzerland
-
 Syria
-
 Taiwan
-
 Tajikistan
-
 Tanzania
-
 Thailand
-
 Trinidad and Tobago
-
 Tunisia
-
 Turkey
-
 UAE
-
 Uganda
-
 Ukraine
-
 United Kingdom
-
United States
-
 Uruguay
-
 Uzbekistan
-
 Venezuela
-
 Vietnam
-
 Yemen
-
 Zambia
-
 Zimbabwe
- Forex
- Crypto












