

Shell stock holds near GBX3,395 resistance as momentum remains weak

Shell (SHEL) stock is trading at GBX3,344, marking a modest intraday gain. The price currently sits above its key moving averages, reflecting elevated positioning amid contained volatility.
 4069.50
4110.00
Highlights
- Shell confirmed its capital structure at 5,532,145,677 ordinary shares with voting rights and no shares in Treasury as of August 28, 2026.
- The stable equity float indicates no current share buybacks or changes to share availability or investor dilution.
- Shell stock is expected to trade in a GBX3,293 to GBX3,395 range over 2 to 3 days, with mixed signals from overbought oscillators and weak momentum biasing the likelihood toward downside movement.
Stable equity float as share capital remains unchanged
Shell’s capital structure was confirmed at 5,532,145,677 ordinary shares with voting rights and no shares held in Treasury as of August 28, 2026, according to Manilatimes. This update signals stability in the company’s equity float, with no ongoing buybacks or reductions that might immediately alter share availability or investor dilution. The maintenance of a consistent capital base supports liquidity and voting structure, providing a neutral backdrop for short-term price movement.
Overbought oscillators meet weak trend signals amid mixed support
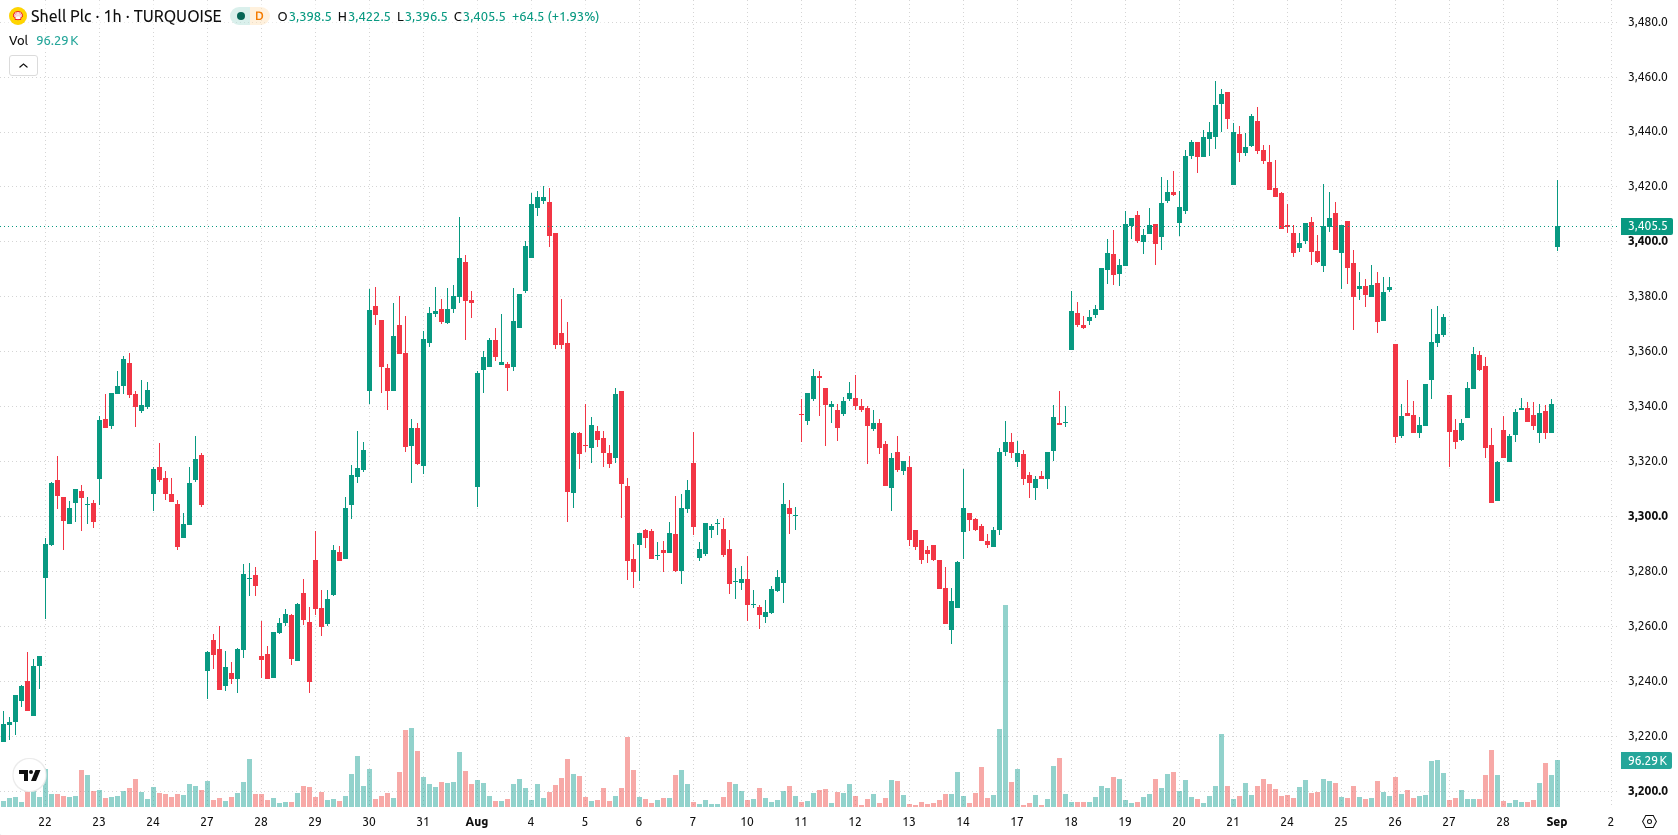
On the hourly chart, SHEL trades above the MA-20 at GBX3,337, but remains below the MA-50 at GBX3,366. The daily MA-200 provides longer-term support at GBX3,072, while immediate support is identified at the Ichimoku Kijun level of GBX3,341 on the daily timeframe. On the indicator front, RSI stands at 48.32 with a Sell signal, MACD is on Strong Sell, and ADX points to a Sell bias. Stochastic RSI is Overbought, CCI is Neutral, Bull/Bear Power is Overbought, and the Awesome Oscillator is Neutral. These readings reveal a divergence, as overbought short-term oscillators contrast with weak momentum across trend-following indicators.
Sideways consolidation expected as mixed signals cap breakouts
Over the next 2–3 trading days, the expected price range is GBX3,293 to GBX3,395, representing a typical volatility band relative to current levels. A sideways scenario is likely, with price consolidating within this range given mixed technical signals. Should resistance be cleared, a bullish extension may follow; conversely, a decisive move below immediate support could trigger further downside pressure.
Earlier, analysts noted that Shell’s technical setup was characterized by mixed momentum signals and an increased likelihood of downside within a narrow trading band. With the company’s capital structure confirmed and no new buyback activity, traders should monitor the GBX3,341 support level as a pivot for near-term directional cues.










-
 Afghanistan
-
 Albania
-
 Algeria
-
 Angola
-
 Argentina
-
 Armenia
-
 Australia
-
 Austria
-
 Azerbaijan
-
 Bahamas
-
 Bahrain
-
 Bangladesh
-
 Belarus
-
 Belgium
-
 Bolivia
-
 Botswana
-
 Brazil
-
 Brunei
-
 Bulgaria
-
 Cambodia
-
 Cameroon
-
 Canada
-
 Chile
-
 China
-
 Colombia
-
 Congo
-
 Costa Rica
-
 Cote d'Ivoire
-
 Croatia
-
 Cuba
-
 Cyprus
-
 Czechia
-
 DR Congo
-
 Denmark
-
 Dominican Republic
-
 Ecuador
-
 Egypt
-
 El Salvador
-
 Estonia
-
 Eswatini
-
 Ethiopia
-
 Finland
-
 France
-
 Georgia
-
 Germany
-
 Ghana
-
 Greece
-
 Haiti
-
 Hong Kong
-
 Hungary
-
 India
-
 Indonesia
-
 Iran, Islamic republic
-
 Iraq
-
 Ireland
-
 Israel
-
 Italy
-
 Jamaica
-
 Japan
-
 Jordan
-
 Kazakhstan
-
 Kenya
-
 Korea
-
 Kuwait
-
 Kyrgyzstan
-
 Laos
-
 Latvia
-
 Lebanon
-
 Lesotho
-
 Libya
-
 Lithuania
-
 Luxembourg
-
 Madagascar
-
 Malaysia
-
 Malta
-
 Mauritius
-
 Mexico
-
 Moldova
-
 Mongolia
-
 Montenegro
-
 Morocco
-
 Mozambique
-
 Myanmar
-
 Namibia
-
 Nepal
-
 Netherlands
-
 New Zealand
-
 Nigeria
-
 North Macedonia
-
 Norway
-
 Oman
-
 Pakistan
-
 Palestine
-
 Panama
-
 Papua New Guinea
-
 Paraguay
-
 Peru
-
 Philippines
-
 Poland
-
 Portugal
-
 Puerto Rico
-
 Qatar
-
 Reunion
-
 Romania
-
 Rwanda
-
 Saudi Arabia
-
 Serbia
-
 Singapore
-
 Slovakia
-
 Slovenia
-
 Somalia
-
 South Africa
-
 Spain
-
 Sri Lanka
-
 Sweden
-
 Switzerland
-
 Syria
-
 Taiwan
-
 Tajikistan
-
 Tanzania
-
 Thailand
-
 Trinidad and Tobago
-
 Tunisia
-
 Turkey
-
 UAE
-
 Uganda
-
 Ukraine
-
 United Kingdom
-
United States
-
 Uruguay
-
 Uzbekistan
-
 Venezuela
-
 Vietnam
-
 Yemen
-
 Zambia
-
 Zimbabwe
- Forex
- Crypto












