

Riot Platforms stock breakout attempt at $19.3 resistance: Upside targets to watch

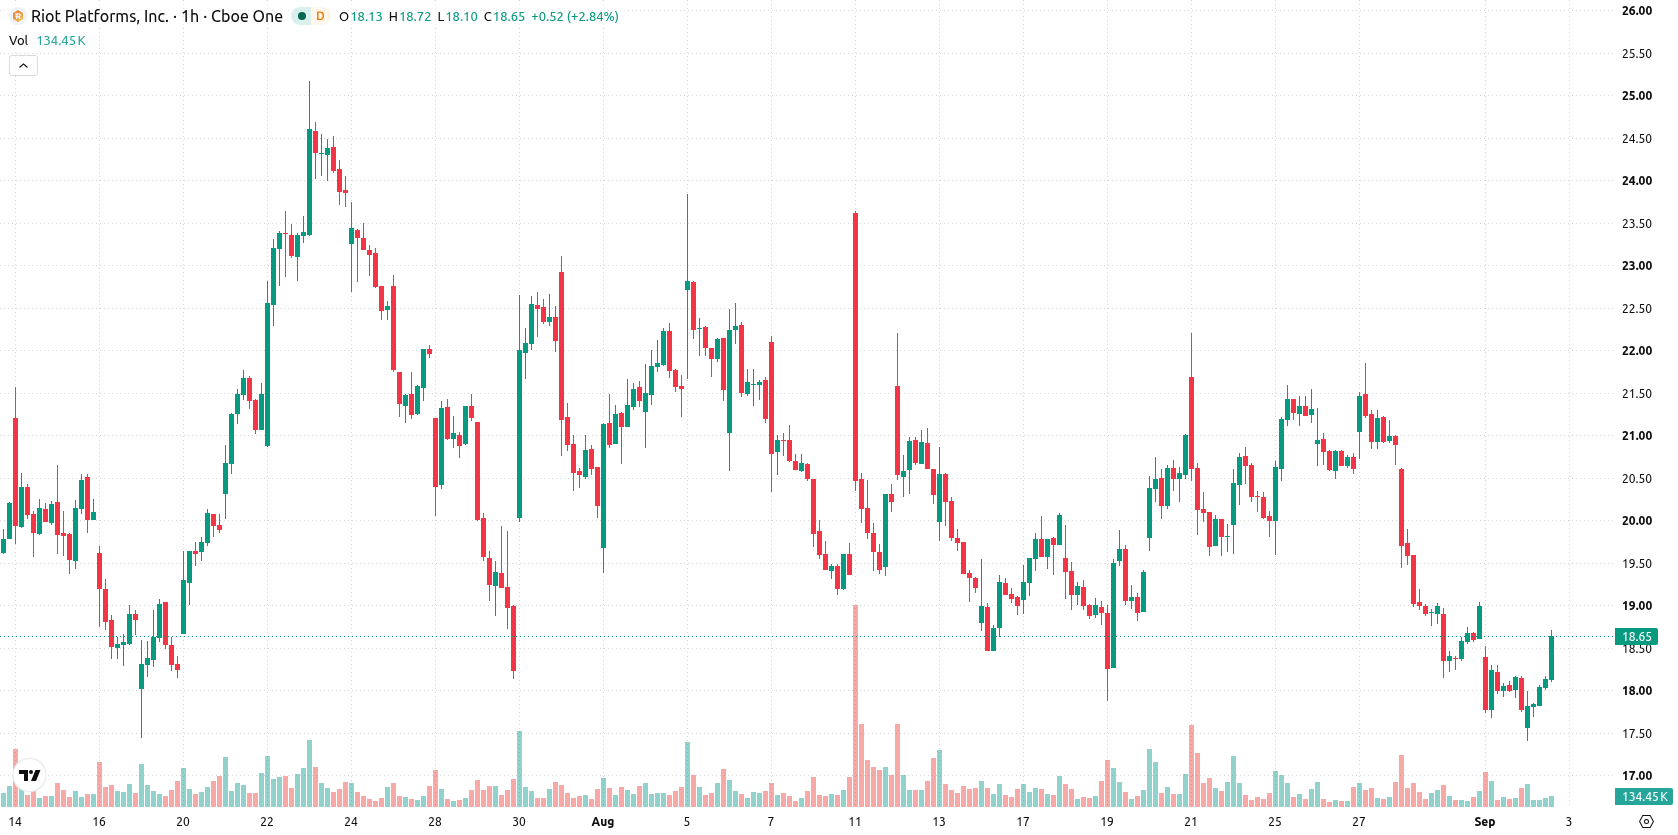
Riot Platforms (RIOT) stock is trading at $18.65 after advancing 4.83% on the day. The price has moved above its short- and long-term moving averages while remaining below the medium-term average, reflecting mixed momentum across timeframes.
 17.84
17.10
Highlights
- RIOT/USD advanced 4.83% to $18.65 today, trading near session highs amid elevated intraday volatility.
- Technical indicators show persistent bearish momentum and seller dominance, though the asset appears mildly oversold.
- Forecasted range for the next sessions is $16.79 to $20.51, with a 67% probability of a downside move.
Persistent technical resistance as momentum signals stay bearish
On the technical front, RIOT has climbed above its MA-20 and daily MA-200 but is still capped by the MA-50 on the H1 chart. The Ichimoku Kijun line sits at $19.3, setting a clear resistance zone in the short term. Momentum indicators highlight ongoing downward pressure, with MACD firmly in Strong Sell and ADX on Sell. RSI reads at 35.71, and CCI is also on Sell, both indicating a mildly oversold condition. Stochastic RSI remains Neutral, while Bull/Bear Power shows seller dominance on an intraday basis. The Awesome Oscillator posts a Neutral reading, signaling a lack of support for the current short-term trend.
Downside favored as volatility range caps upside potential
In the short term, RIOT is expected to trade between $16.79 and $20.51, reflecting a firm volatility band relative to current levels. The probability of a move higher is 33%, while a downward move is considered more likely at 67%. Baseline expectations point to sideways consolidation within this established range. A break above the $19.3 Kijun resistance could trigger a bullish scenario, while failure to hold above $16.79 may open the door for further downside.
Earlier, analysts noted that Riot Platforms was showing sustained technical weakness and elevated downside risk. The latest price action supports this cautious view, with current indicators signaling that traders should closely monitor the $16.79 level for potential downside acceleration.









-
 Afghanistan
-
 Albania
-
 Algeria
-
 Angola
-
 Argentina
-
 Armenia
-
 Australia
-
 Austria
-
 Azerbaijan
-
 Bahamas
-
 Bahrain
-
 Bangladesh
-
 Belarus
-
 Belgium
-
 Bolivia
-
 Botswana
-
 Brazil
-
 Brunei
-
 Bulgaria
-
 Cambodia
-
 Cameroon
-
 Canada
-
 Chile
-
 China
-
 Colombia
-
 Congo
-
 Costa Rica
-
 Cote d'Ivoire
-
 Croatia
-
 Cuba
-
 Cyprus
-
 Czechia
-
 DR Congo
-
 Denmark
-
 Dominican Republic
-
 Ecuador
-
 Egypt
-
 El Salvador
-
 Estonia
-
 Eswatini
-
 Ethiopia
-
 Finland
-
 France
-
 Georgia
-
 Germany
-
 Ghana
-
 Greece
-
 Haiti
-
 Hong Kong
-
 Hungary
-
 India
-
 Indonesia
-
 Iran, Islamic republic
-
 Iraq
-
 Ireland
-
 Israel
-
 Italy
-
 Jamaica
-
 Japan
-
 Jordan
-
 Kazakhstan
-
 Kenya
-
 Korea
-
 Kuwait
-
 Kyrgyzstan
-
 Laos
-
 Latvia
-
 Lebanon
-
 Lesotho
-
 Libya
-
 Lithuania
-
 Luxembourg
-
 Madagascar
-
 Malaysia
-
 Malta
-
 Mauritius
-
 Mexico
-
 Moldova
-
 Mongolia
-
 Montenegro
-
 Morocco
-
 Mozambique
-
 Myanmar
-
 Namibia
-
 Nepal
-
 Netherlands
-
 New Zealand
-
 Nigeria
-
 North Macedonia
-
 Norway
-
 Oman
-
 Pakistan
-
 Palestine
-
 Panama
-
 Papua New Guinea
-
 Paraguay
-
 Peru
-
 Philippines
-
 Poland
-
 Portugal
-
 Puerto Rico
-
 Qatar
-
 Reunion
-
 Romania
-
 Rwanda
-
 Saudi Arabia
-
 Serbia
-
 Singapore
-
 Slovakia
-
 Slovenia
-
 Somalia
-
 South Africa
-
 Spain
-
 Sri Lanka
-
 Sweden
-
 Switzerland
-
 Syria
-
 Taiwan
-
 Tajikistan
-
 Tanzania
-
 Thailand
-
 Trinidad and Tobago
-
 Tunisia
-
 Turkey
-
 UAE
-
 Uganda
-
 Ukraine
-
 United Kingdom
-
United States
-
 Uruguay
-
 Uzbekistan
-
 Venezuela
-
 Vietnam
-
 Yemen
-
 Zambia
-
 Zimbabwe
- Forex
- Crypto












