

Lululemon Athletica shares drop around 17.5% after Q2 sales miss and lowered 2026 outlook

Lululemon Athletica Inc. (LULU) plunged 17.44% after the company missed sales estimates in its fiscal Q2 2026 earnings report and lowered its revenue and profit guidance, citing softer North American demand. The magnitude of the decline is reinforced by persistent selling pressure, with the stock trading below all key moving averages and downside momentum confirmed across short, medium, and long-term timeframes.
 111.62
Highlights
- Lululemon Athletica reported fiscal Q2 2026 revenue of $2.42 billion, down 4% year over year, with earnings per share of $2.92 aided by an $0.86 per share tariff refund benefit.
- Comparable sales declined 9%, driven by weakness in North America, and the company lowered its full-year revenue and earnings guidance with a CEO transition planned to Heidi O'Neill.
- Shares of Lululemon stock dropped 17.44% to $100.54 with technical levels setting a near-term range of $97.99 to $103.16; momentum indicators diverge but suggest consolidation near current prices.
Guidance cuts and CEO transition fuel negative outlook
Lululemon Athletica reported fiscal Q2 2026 revenue of $2.42 billion, a 4% year-over-year decline, with earnings per share at $2.92 including an $0.86 per share benefit from tariff refunds. The company reported a 9% decrease in comparable sales, especially in North America, and lowered its full-year revenue and earnings guidance below previous estimates. The upcoming transition to Heidi O'Neill as CEO and the recent resolution of proxy disputes involving founder Chip Wilson were also announced.
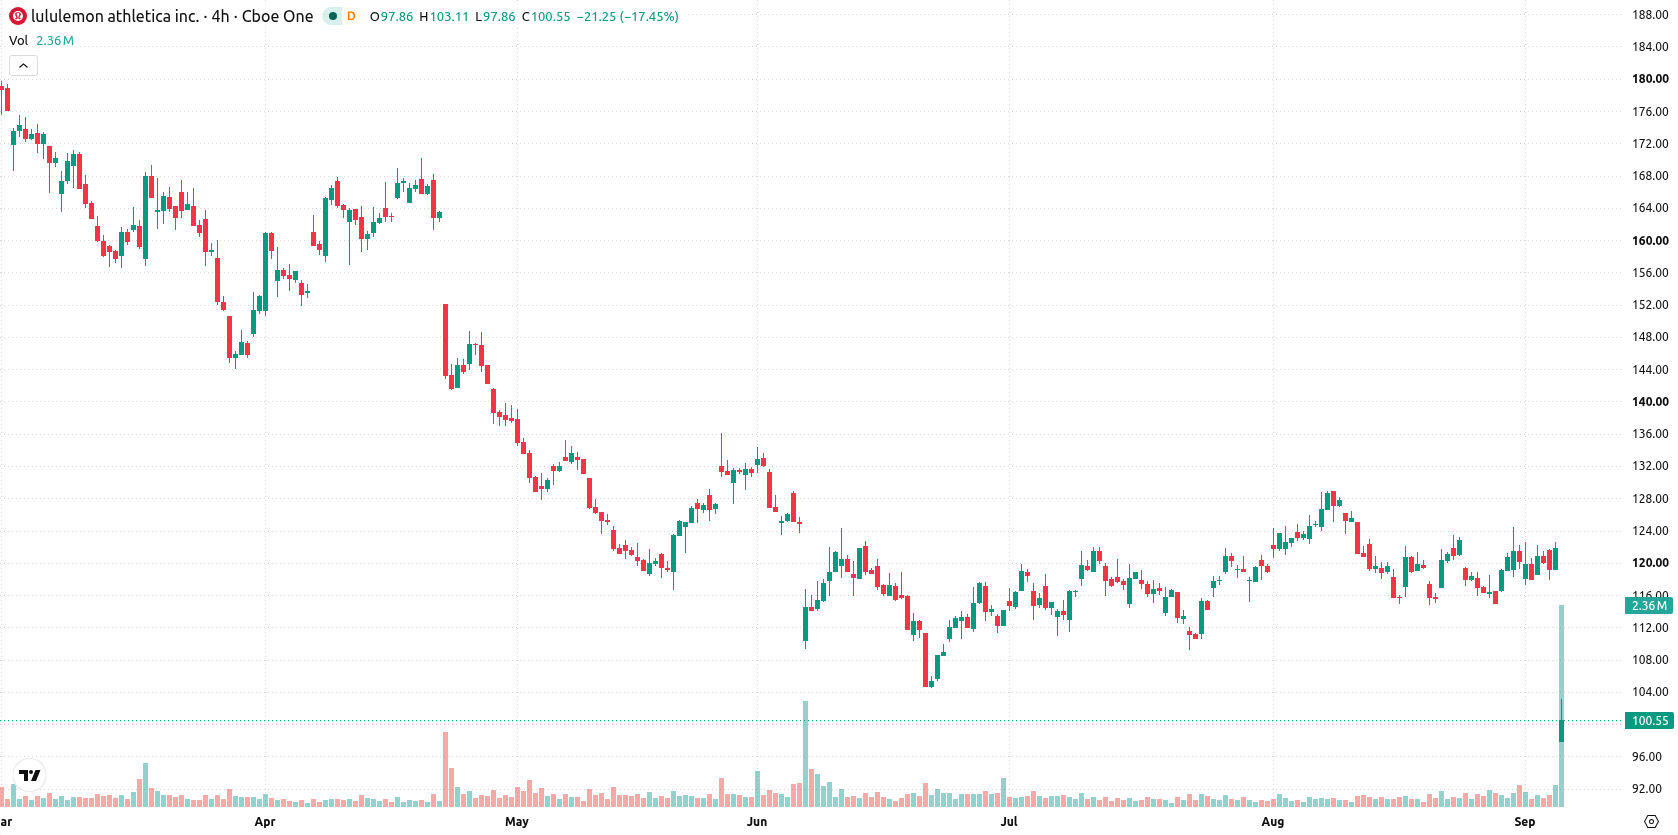
Bearish trends persist as momentum signals diverge sharply
Lululemon Athletica is trading below its 20-day ($120.3), 50-day ($118.63), and 200-day ($153.09) moving averages, reflecting persistent selling pressure across all timeframes. The immediate trading band is defined by a near-term floor at $97.99 and a ceiling at $103.16, with broader trend confirmation coming from the bearish alignment between the 50-day and 200-day averages. Momentum readings present a mixed picture. The MACD and Average Directional Index (ADX) both indicate neutral momentum, while the Relative Strength Index (RSI) at 53.45 and Commodity Channel Index (CCI) near 11.1 signal neither overbought nor oversold conditions. However, Stochastic RSI at 92.74 and Bull/Bear Power (BBP) at 2.98 both flag overbought territory, with BBP confirming buyer dominance intraday. The Awesome Oscillator (AO) supports the ongoing buying bias. The stock has dropped to $100.54, down $21.235 or 17.44%, following a pronounced downside gap of about $23.57 (19.36%) at the open. Price is mid-range between support and resistance, with intraday volatility amplitude at 5.28%. Intraday tone shows weakness following the sharp open and moderate volatility, while oscillators and momentum indicators highlight divergences between buying activity and overall trend pressure.
Previously, it was reported that Lululemon Athletica experienced a significant drop after issuing a weaker outlook and missing quarterly expectations. The latest results reinforce the prevailing downside scenario, with traders now watching the $97.99 support as a key level for immediate risk management.






Latest Lululemon Athletica News





-
 Afghanistan
-
 Albania
-
 Algeria
-
 Angola
-
 Argentina
-
 Armenia
-
 Australia
-
 Austria
-
 Azerbaijan
-
 Bahamas
-
 Bahrain
-
 Bangladesh
-
 Belarus
-
 Belgium
-
 Bolivia
-
 Botswana
-
 Brazil
-
 Brunei
-
 Bulgaria
-
 Cambodia
-
 Cameroon
-
 Canada
-
 Chile
-
 China
-
 Colombia
-
 Congo
-
 Costa Rica
-
 Cote d'Ivoire
-
 Croatia
-
 Cuba
-
 Cyprus
-
 Czechia
-
 DR Congo
-
 Denmark
-
 Dominican Republic
-
 Ecuador
-
 Egypt
-
 El Salvador
-
 Estonia
-
 Eswatini
-
 Ethiopia
-
 Finland
-
 France
-
 Georgia
-
 Germany
-
 Ghana
-
 Greece
-
 Haiti
-
 Hong Kong
-
 Hungary
-
 India
-
 Indonesia
-
 Iran, Islamic republic
-
 Iraq
-
 Ireland
-
 Israel
-
 Italy
-
 Jamaica
-
 Japan
-
 Jordan
-
 Kazakhstan
-
 Kenya
-
 Korea
-
 Kuwait
-
 Kyrgyzstan
-
 Laos
-
 Latvia
-
 Lebanon
-
 Lesotho
-
 Libya
-
 Lithuania
-
 Luxembourg
-
 Madagascar
-
 Malaysia
-
 Malta
-
 Mauritius
-
 Mexico
-
 Moldova
-
 Mongolia
-
 Montenegro
-
 Morocco
-
 Mozambique
-
 Myanmar
-
 Namibia
-
 Nepal
-
 Netherlands
-
 New Zealand
-
 Nigeria
-
 North Macedonia
-
 Norway
-
 Oman
-
 Pakistan
-
 Palestine
-
 Panama
-
 Papua New Guinea
-
 Paraguay
-
 Peru
-
 Philippines
-
 Poland
-
 Portugal
-
 Puerto Rico
-
 Qatar
-
 Reunion
-
 Romania
-
 Rwanda
-
 Saudi Arabia
-
 Serbia
-
 Singapore
-
 Slovakia
-
 Slovenia
-
 Somalia
-
 South Africa
-
 Spain
-
 Sri Lanka
-
 Sweden
-
 Switzerland
-
 Syria
-
 Taiwan
-
 Tajikistan
-
 Tanzania
-
 Thailand
-
 Trinidad and Tobago
-
 Tunisia
-
 Turkey
-
 UAE
-
 Uganda
-
 Ukraine
-
 United Kingdom
-
United States
-
 Uruguay
-
 Uzbekistan
-
 Venezuela
-
 Vietnam
-
 Yemen
-
 Zambia
-
 Zimbabwe
- Forex
- Crypto












