

Marathon Digital stock support test: Downside targets to watch

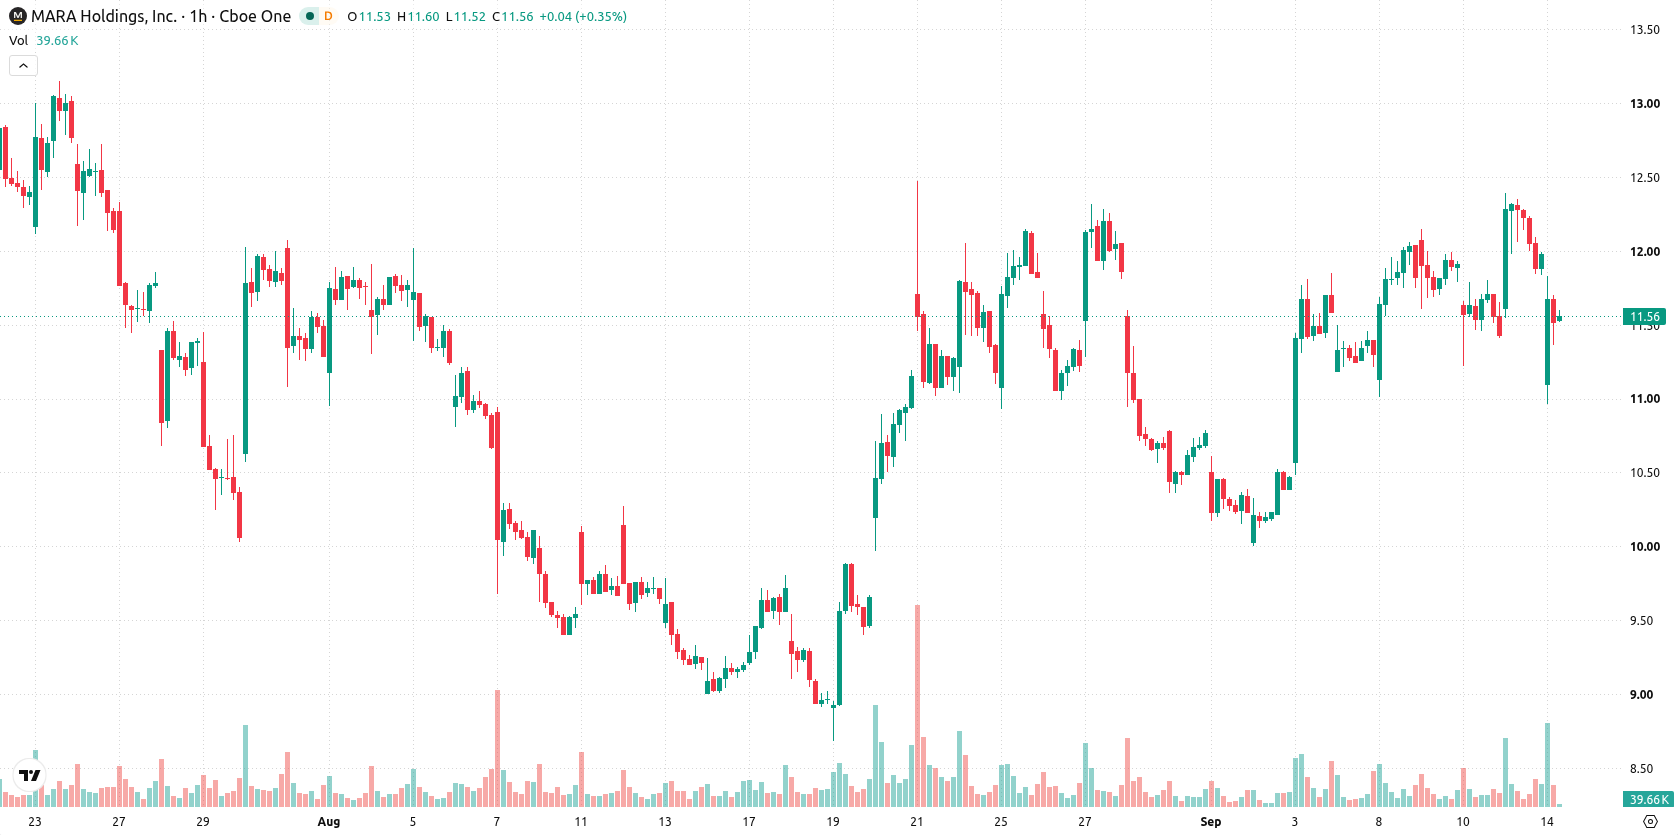
Marathon Digital Holdings, Inc. (MARA) stock is trading at $11.54, marking a daily decline of 3.75%. The price currently sits below its short-term moving averages but continues to hold above some longer-term trend levels.
 6.81
7.46
Highlights
- MARA/USD fell 3.75% to $11.54, closing near the session low with high volatility and a negative intraday tone.
- Short-term signals are mixed, with bullish momentum from the MACD and RSI but several oscillators show neutral readings and trend strength is unclear.
- Price is expected to move within the $10.98 to $12.1 range, with key resistance at $11.81 and support at $10.98.
Mixed momentum signals as session closes on volatility and resistance
MARA/USD is trading below its MA-20 level at $11.86, but remains above the MA-50 at $11.49 and MA-200 at $10.94. The Ichimoku Kijun sits at $11.81, establishing immediate resistance overhead. Momentum signals show divergence: MACD gives a strong buy reading, while ADX remains neutral, and RSI prints a moderately bullish 54.71. Both the Stoch RSI and CCI are neutral, giving no overbought or oversold signal. Bull/Bear Power signals strong intraday buyer dominance, whereas the Awesome Oscillator is neutral. Today's session was volatile, closing at the session low after a downside gap, with a negative tone and mixed indications across oscillators.
Sideways outlook prevails amid resistance and support boundaries
The short-term outlook for MARA/USD places the expected price range at $10.98–$12.1, in line with recent volatility. The baseline scenario is for continued sideways trading within this corridor. Should price break above the $11.81 resistance, a bullish move targeting the upper end of the range could unfold. Conversely, a breakdown below $10.98 support would raise the likelihood of further declines.
Earlier, analysts noted that Marathon Digital’s bullish momentum remained intact despite growing concerns over its strategic direction and recent downgrades. The current technical setup signals mixed momentum and increased volatility, highlighting the importance of the $11.81 resistance and $10.98 support as the key levels to monitor for potential breakout or breakdown scenarios.









-
 Afghanistan
-
 Albania
-
 Algeria
-
 Angola
-
 Argentina
-
 Armenia
-
 Australia
-
 Austria
-
 Azerbaijan
-
 Bahamas
-
 Bahrain
-
 Bangladesh
-
 Belarus
-
 Belgium
-
 Bolivia
-
 Botswana
-
 Brazil
-
 Brunei
-
 Bulgaria
-
 Cambodia
-
 Cameroon
-
 Canada
-
 Chile
-
 China
-
 Colombia
-
 Congo
-
 Costa Rica
-
 Cote d'Ivoire
-
 Croatia
-
 Cuba
-
 Cyprus
-
 Czechia
-
 DR Congo
-
 Denmark
-
 Dominican Republic
-
 Ecuador
-
 Egypt
-
 El Salvador
-
 Estonia
-
 Eswatini
-
 Ethiopia
-
 Finland
-
 France
-
 Georgia
-
 Germany
-
 Ghana
-
 Greece
-
 Haiti
-
 Hong Kong
-
 Hungary
-
 India
-
 Indonesia
-
 Iran, Islamic republic
-
 Iraq
-
 Ireland
-
 Israel
-
 Italy
-
 Jamaica
-
 Japan
-
 Jordan
-
 Kazakhstan
-
 Kenya
-
 Korea
-
 Kuwait
-
 Kyrgyzstan
-
 Laos
-
 Latvia
-
 Lebanon
-
 Lesotho
-
 Libya
-
 Lithuania
-
 Luxembourg
-
 Madagascar
-
 Malaysia
-
 Malta
-
 Mauritius
-
 Mexico
-
 Moldova
-
 Mongolia
-
 Montenegro
-
 Morocco
-
 Mozambique
-
 Myanmar
-
 Namibia
-
 Nepal
-
 Netherlands
-
 New Zealand
-
 Nigeria
-
 North Macedonia
-
 Norway
-
 Oman
-
 Pakistan
-
 Palestine
-
 Panama
-
 Papua New Guinea
-
 Paraguay
-
 Peru
-
 Philippines
-
 Poland
-
 Portugal
-
 Puerto Rico
-
 Qatar
-
 Reunion
-
 Romania
-
 Rwanda
-
 Saudi Arabia
-
 Serbia
-
 Singapore
-
 Slovakia
-
 Slovenia
-
 Somalia
-
 South Africa
-
 Spain
-
 Sri Lanka
-
 Sweden
-
 Switzerland
-
 Syria
-
 Taiwan
-
 Tajikistan
-
 Tanzania
-
 Thailand
-
 Trinidad and Tobago
-
 Tunisia
-
 Turkey
-
 UAE
-
 Uganda
-
 Ukraine
-
 United Kingdom
-
United States
-
 Uruguay
-
 Uzbekistan
-
 Venezuela
-
 Vietnam
-
 Yemen
-
 Zambia
-
 Zimbabwe
- Forex
- Crypto












