


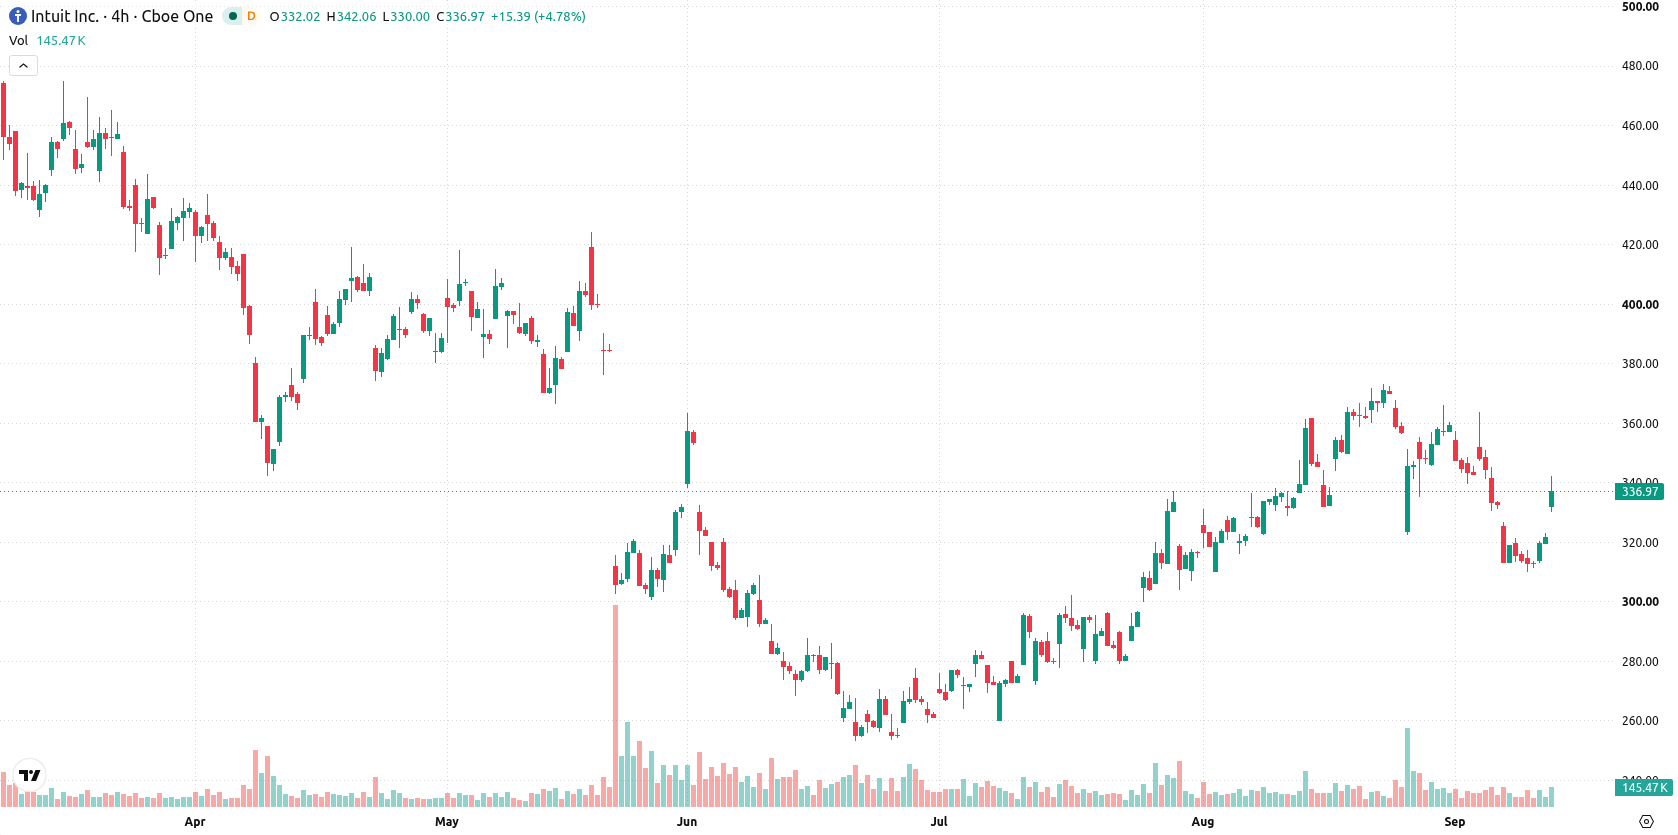
Intuit Inc. (INTU) rallied 4.87% after the board approved a 15% increase in the quarterly dividend, drawing attention to renewed shareholder returns. The rebound looks limited, with Intuit trading below its 20-day and 200-day moving averages, while only medium-term support remains intact.
 350.73
356.56
Highlights
- Intuit approved a 15% increase in its quarterly dividend to $1.38 per share, with an ex-dividend date of October 8, 2026.
- The company is advancing customer acquisition and AI-enabled financial workflows, while institutional investors trimmed holdings in the second quarter.
- Shares of Intuit remain below major moving averages with a 63% probability of a downward move in the next 5 trading days and an expected range of $331.27 to $343.25.
Investor outflows and product expansion shape sentiment shift
Intuit's board approved a quarterly dividend of $1.38 per share, representing a 15% increase year-over-year, with an ex-dividend date of October 8, 2026. The company is actively expanding growth initiatives, focusing on customer acquisition, enhancing AI-driven financial workflows, and broadening its payments ecosystem through products such as Bill Pay and the QuickBooks Business Credit Card. Institutional investors, including Sequoia Financial Advisors LLC and NewEdge Advisors LLC, reduced their holdings in Intuit during the second quarter. Intuit also set updated earnings guidance, reporting ongoing investments in product innovation and customer-focused strategies.
Oversold signals highlight rebound amid persistent bearish pressure
Intuit is currently trading below its 20-day and 200-day moving averages at $344.61 and $420.57, but remains above the 50-day moving average at $319.75. This structure shows persistent short- and long-term bearish pressure, though medium-term support holds. The near-term resistance sits at $340.56, while support is established at $333.12, and the Ichimoku Kijun at $341.62 acts as immediate resistance. Momentum signals are mixed: the MACD and ADX indicate a neutral trend, the RSI at 43.8 and CCI at -127.83 highlight oversold conditions, with a deeply oversold Stochastic RSI at 17.38 and BBP at -9.82, both confirming intraday selling dominance. The Awesome Oscillator reinforces this downtrend signal. The stock is up $15.68 for the day after an upside gap at the open, currently trading mid-band with a 2.23% amplitude. This signals a sharp intraday rebound, but underlying momentum remains contradictory.
Previously it was reported that Intuit's stock faced persistent bearish pressure amid mixed technical signals and insider activity. The current rebound, driven by a dividend increase and ongoing product expansion, adds a new dimension but sustained resistance suggests that traders should monitor $340.56 as a key level for any potential upside continuation.










-
 Afghanistan
-
 Albania
-
 Algeria
-
 Angola
-
 Argentina
-
 Armenia
-
 Australia
-
 Austria
-
 Azerbaijan
-
 Bahamas
-
 Bahrain
-
 Bangladesh
-
 Belarus
-
 Belgium
-
 Bolivia
-
 Botswana
-
 Brazil
-
 Brunei
-
 Bulgaria
-
 Cambodia
-
 Cameroon
-
 Canada
-
 Chile
-
 China
-
 Colombia
-
 Congo
-
 Costa Rica
-
 Cote d'Ivoire
-
 Croatia
-
 Cuba
-
 Cyprus
-
 Czechia
-
 DR Congo
-
 Denmark
-
 Dominican Republic
-
 Ecuador
-
 Egypt
-
 El Salvador
-
 Estonia
-
 Eswatini
-
 Ethiopia
-
 Finland
-
 France
-
 Georgia
-
 Germany
-
 Ghana
-
 Greece
-
 Haiti
-
 Hong Kong
-
 Hungary
-
 India
-
 Indonesia
-
 Iran, Islamic republic
-
 Iraq
-
 Ireland
-
 Israel
-
 Italy
-
 Jamaica
-
 Japan
-
 Jordan
-
 Kazakhstan
-
 Kenya
-
 Korea
-
 Kuwait
-
 Kyrgyzstan
-
 Laos
-
 Latvia
-
 Lebanon
-
 Lesotho
-
 Libya
-
 Lithuania
-
 Luxembourg
-
 Madagascar
-
 Malaysia
-
 Malta
-
 Mauritius
-
 Mexico
-
 Moldova
-
 Mongolia
-
 Montenegro
-
 Morocco
-
 Mozambique
-
 Myanmar
-
 Namibia
-
 Nepal
-
 Netherlands
-
 New Zealand
-
 Nigeria
-
 North Macedonia
-
 Norway
-
 Oman
-
 Pakistan
-
 Palestine
-
 Panama
-
 Papua New Guinea
-
 Paraguay
-
 Peru
-
 Philippines
-
 Poland
-
 Portugal
-
 Puerto Rico
-
 Qatar
-
 Reunion
-
 Romania
-
 Rwanda
-
 Saudi Arabia
-
 Serbia
-
 Singapore
-
 Slovakia
-
 Slovenia
-
 Somalia
-
 South Africa
-
 Spain
-
 Sri Lanka
-
 Sweden
-
 Switzerland
-
 Syria
-
 Taiwan
-
 Tajikistan
-
 Tanzania
-
 Thailand
-
 Trinidad and Tobago
-
 Tunisia
-
 Turkey
-
 UAE
-
 Uganda
-
 Ukraine
-
 United Kingdom
-
United States
-
 Uruguay
-
 Uzbekistan
-
 Venezuela
-
 Vietnam
-
 Yemen
-
 Zambia
-
 Zimbabwe
- Forex
- Crypto












