

Marathon Digital stock resistance test: Breakout levels to watch

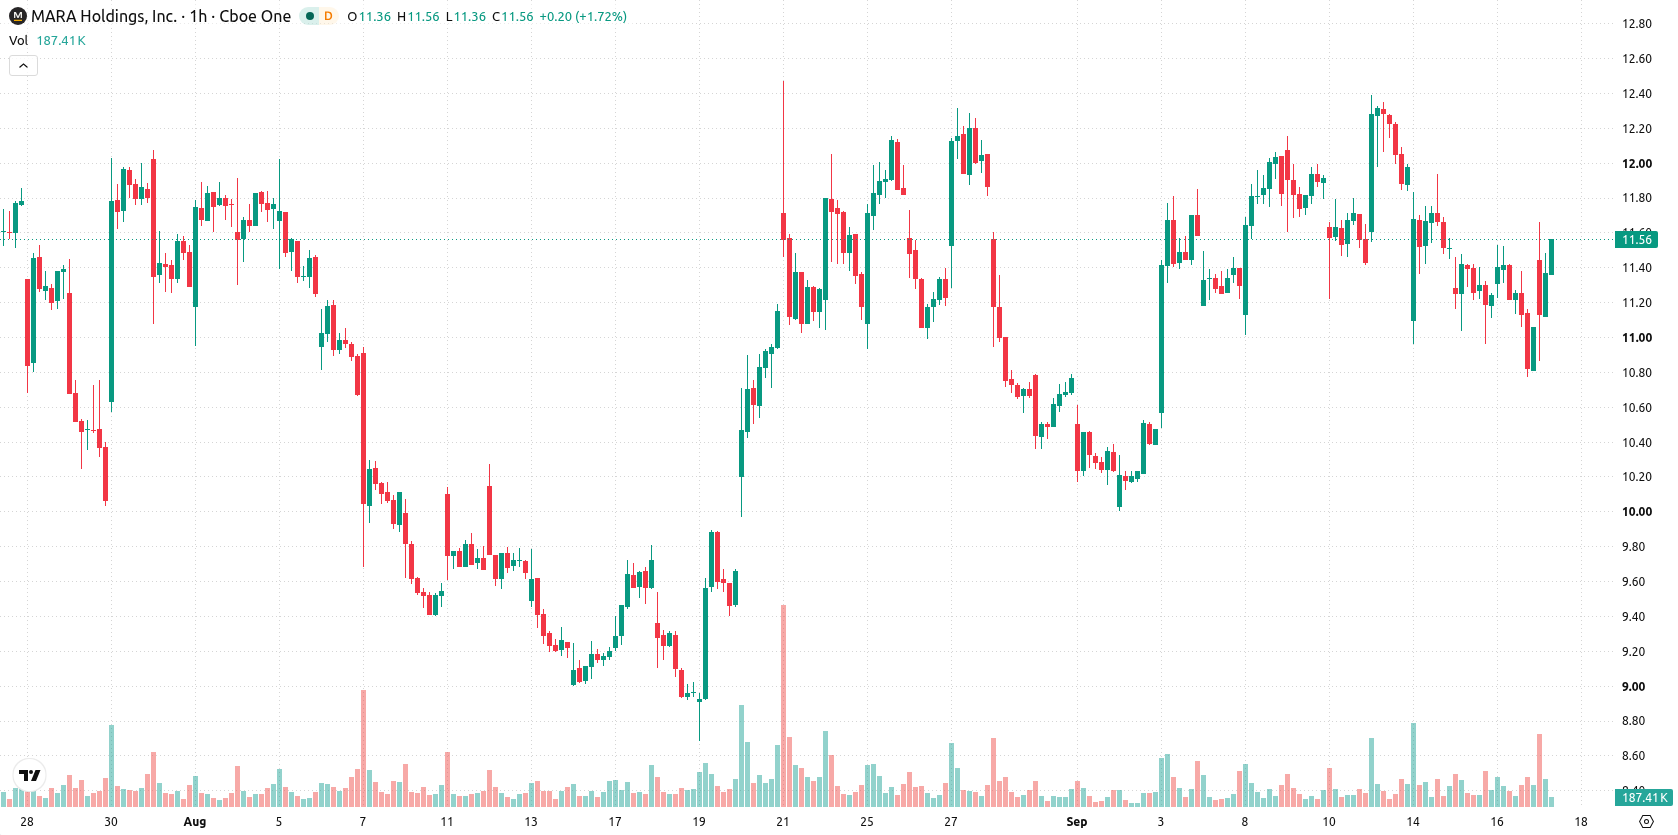
Marathon Digital (MARA) stock is trading at $11.5, up 4.36% on the day. Price is holding near today's high and remains above key short- and long-term moving averages, with strong relative positioning.
 6.89
7.46
Highlights
- Marathon Digital confirmed that its reported 1,292 Bitcoin transaction in September 2026 was a loan repayment, not a new purchase.
- The company holds 9,270 Bitcoin as loan collateral and sold 20,880 to 23,093 Bitcoin between January and June 2026, raising $1.5 billion to $1.63 billion.
- Shares of Marathon Digital are expected to trade between $10.44 and $12.21 over the next three days, with technical indicators showing weak intraday momentum and a slightly higher probability of a downward move.
Liquidity constraints persist as Bitcoin sale clarifies balance sheet strategy
Marathon Digital clarified on September 17, 2026, that its previously reported 1,292 Bitcoin deal was in fact a loan repayment and not a fresh acquisition, helping to dispel market uncertainty over its near-term buying activity. The company's disclosure that 9,270 BTC remain pledged as loan collateral limits flexibility for further balance sheet moves, placing some constraints on immediate liquidity. Additionally, between January and June 2026, Marathon sold between 20,880 and 23,093 Bitcoin, raising $1.5 billion to $1.63 billion for strategic investments and balance sheet management, according to Cryptobriefing, which actively supports its capital reserves in a volatile market environment.
Mixed technical signals weigh as intraday momentum diverges at support and resistance
MARA is trading above the MA-20 but below the MA-50 on the 1-hour chart, while maintaining a firm position above the MA-200 on the daily chart. Immediate resistance is defined by the Ichimoku Kijun level at $11.57, while support lies in the $10.44 zone. Momentum indicators show both MACD and ADX on intraday charts signaling a sell bias. The RSI is near 40 in the sell region, and CCI is oversold, as is confirmed by negative readings from Awesome Oscillator and Bull/Bear Power. However, Stochastic RSI signals a strong buy, highlighting a divergence among oscillators.
Rangebound outlook dominates as probabilities tilt toward short-term downside
Over the next 2 to 3 trading days, MARA is expected to fluctuate within a typical volatility band between $10.44 and $12.21. Scenario probabilities slightly favor a downward move (54%) over an upward breakout (46%). The baseline outlook is for price action to remain rangebound unless a sustained break above $11.57 occurs, while a move below support at $10.44 could see bears regain control in the short term.
Earlier, analysts noted that Marathon Digital faced downside pressure amid regulatory uncertainty and mixed technical signals. The current outlook adds clarity on the company's recent Bitcoin transactions and ongoing liquidity constraints, with key attention on the $11.57 resistance and $10.44 support as pivotal levels for upcoming price action.









-
 Afghanistan
-
 Albania
-
 Algeria
-
 Angola
-
 Argentina
-
 Armenia
-
 Australia
-
 Austria
-
 Azerbaijan
-
 Bahamas
-
 Bahrain
-
 Bangladesh
-
 Belarus
-
 Belgium
-
 Bolivia
-
 Botswana
-
 Brazil
-
 Brunei
-
 Bulgaria
-
 Cambodia
-
 Cameroon
-
 Canada
-
 Chile
-
 China
-
 Colombia
-
 Congo
-
 Costa Rica
-
 Cote d'Ivoire
-
 Croatia
-
 Cuba
-
 Cyprus
-
 Czechia
-
 DR Congo
-
 Denmark
-
 Dominican Republic
-
 Ecuador
-
 Egypt
-
 El Salvador
-
 Estonia
-
 Eswatini
-
 Ethiopia
-
 Finland
-
 France
-
 Georgia
-
 Germany
-
 Ghana
-
 Greece
-
 Haiti
-
 Hong Kong
-
 Hungary
-
 India
-
 Indonesia
-
 Iran, Islamic republic
-
 Iraq
-
 Ireland
-
 Israel
-
 Italy
-
 Jamaica
-
 Japan
-
 Jordan
-
 Kazakhstan
-
 Kenya
-
 Korea
-
 Kuwait
-
 Kyrgyzstan
-
 Laos
-
 Latvia
-
 Lebanon
-
 Lesotho
-
 Libya
-
 Lithuania
-
 Luxembourg
-
 Madagascar
-
 Malaysia
-
 Malta
-
 Mauritius
-
 Mexico
-
 Moldova
-
 Mongolia
-
 Montenegro
-
 Morocco
-
 Mozambique
-
 Myanmar
-
 Namibia
-
 Nepal
-
 Netherlands
-
 New Zealand
-
 Nigeria
-
 North Macedonia
-
 Norway
-
 Oman
-
 Pakistan
-
 Palestine
-
 Panama
-
 Papua New Guinea
-
 Paraguay
-
 Peru
-
 Philippines
-
 Poland
-
 Portugal
-
 Puerto Rico
-
 Qatar
-
 Reunion
-
 Romania
-
 Rwanda
-
 Saudi Arabia
-
 Serbia
-
 Singapore
-
 Slovakia
-
 Slovenia
-
 Somalia
-
 South Africa
-
 Spain
-
 Sri Lanka
-
 Sweden
-
 Switzerland
-
 Syria
-
 Taiwan
-
 Tajikistan
-
 Tanzania
-
 Thailand
-
 Trinidad and Tobago
-
 Tunisia
-
 Turkey
-
 UAE
-
 Uganda
-
 Ukraine
-
 United Kingdom
-
United States
-
 Uruguay
-
 Uzbekistan
-
 Venezuela
-
 Vietnam
-
 Yemen
-
 Zambia
-
 Zimbabwe
- Forex
- Crypto












