

S&P 500 index deletion triggers selloff: Can The Trade Desk stock hold $11.98 support?

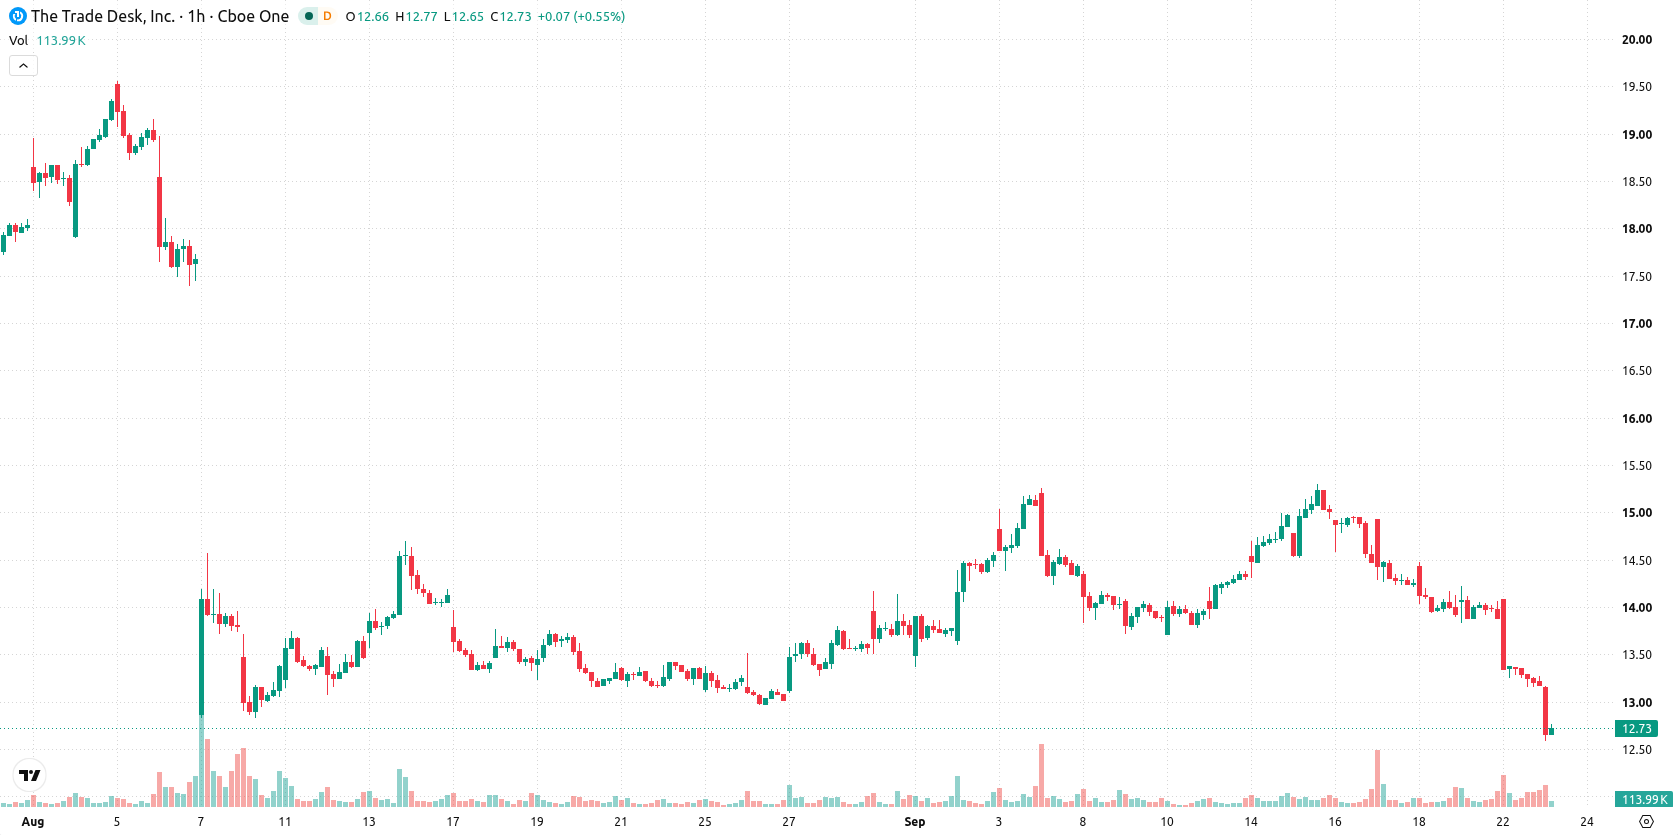
The Trade Desk (TTD) stock is trading at $12.67 after slipping 3.87% on the day and remains below its key moving averages.
 12.68
13.09
Highlights
- Shares of The Trade Desk faced selling pressure from passive funds after S&P 500 removal during the September quarterly rebalance, increasing near-term supply.
- OptimizeRx integrated with OpenPath, expanding The Trade Desk platform's access to authenticated healthcare advertising inventory for clients.
- The Trade Desk stock trades below key moving averages with strong bearish momentum; price closed at $12.67 with expected range of $11.98 to $13.36.
Index deletions and integration news drive liquidity shifts for TTD
Index-removal flows are putting pressure on The Trade Desk, as passive funds tracking the S&P 500 mechanically sold shares following its deletion in the September quarterly rebalance, according to Aol. This event increases available supply in the market and disrupts short-term liquidity for TTD. Additionally, OptimizeRx Corp. announced an integration with OpenPath, The Trade Desk's supply path optimization solution, expanding access to authenticated healthcare point-of-care inventory for advertisers on its platform, as reported by Finance Yahoo.
Technical resistance and oversold signals reinforce bearish market tone
TTD is trading below its MA-20 and MA-50 on the hourly chart and remains well below the MA-200 on the daily. The Ichimoku Kijun level at $13.83 acts as immediate resistance. Momentum indicators such as MACD and ADX confirm a sell bias, while RSI, Stoch RSI, and CCI are all in oversold territory. Bull/Bear Power points to continued seller dominance, and the Awesome Oscillator remains neutral without reinforcing the prevailing trend.
Potential breakdown risk looms as trading range constricts
Over the coming days, TTD is expected to consolidate within a $11.98 to $13.36 range in line with typical volatility for the stock. An upward move remains unlikely unless resistance at $13.83 is cleared. A sustained break below $11.98 would expose the stock to further declines, while range-bound trading will persist if support holds.
Previously it was reported that The Trade Desk was experiencing persistent downside momentum with risk of further declines after weak earnings and technical breakdowns. The current analysis strengthens this view, highlighting that index-related selling and oversold technicals continue to pressure the stock, making the $11.98 support level a critical threshold to watch for additional downside risk.






Latest The Trade Desk News


-
 Afghanistan
-
 Albania
-
 Algeria
-
 Angola
-
 Argentina
-
 Armenia
-
 Australia
-
 Austria
-
 Azerbaijan
-
 Bahamas
-
 Bahrain
-
 Bangladesh
-
 Belarus
-
 Belgium
-
 Bolivia
-
 Botswana
-
 Brazil
-
 Brunei
-
 Bulgaria
-
 Cambodia
-
 Cameroon
-
 Canada
-
 Chile
-
 China
-
 Colombia
-
 Congo
-
 Costa Rica
-
 Cote d'Ivoire
-
 Croatia
-
 Cuba
-
 Cyprus
-
 Czechia
-
 DR Congo
-
 Denmark
-
 Dominican Republic
-
 Ecuador
-
 Egypt
-
 El Salvador
-
 Estonia
-
 Eswatini
-
 Ethiopia
-
 Finland
-
 France
-
 Georgia
-
 Germany
-
 Ghana
-
 Greece
-
 Haiti
-
 Hong Kong
-
 Hungary
-
 India
-
 Indonesia
-
 Iran, Islamic republic
-
 Iraq
-
 Ireland
-
 Israel
-
 Italy
-
 Jamaica
-
 Japan
-
 Jordan
-
 Kazakhstan
-
 Kenya
-
 Korea
-
 Kuwait
-
 Kyrgyzstan
-
 Laos
-
 Latvia
-
 Lebanon
-
 Lesotho
-
 Libya
-
 Lithuania
-
 Luxembourg
-
 Madagascar
-
 Malaysia
-
 Malta
-
 Mauritius
-
 Mexico
-
 Moldova
-
 Mongolia
-
 Montenegro
-
 Morocco
-
 Mozambique
-
 Myanmar
-
 Namibia
-
 Nepal
-
 Netherlands
-
 New Zealand
-
 Nigeria
-
 North Macedonia
-
 Norway
-
 Oman
-
 Pakistan
-
 Palestine
-
 Panama
-
 Papua New Guinea
-
 Paraguay
-
 Peru
-
 Philippines
-
 Poland
-
 Portugal
-
 Puerto Rico
-
 Qatar
-
 Reunion
-
 Romania
-
 Rwanda
-
 Saudi Arabia
-
 Serbia
-
 Singapore
-
 Slovakia
-
 Slovenia
-
 Somalia
-
 South Africa
-
 Spain
-
 Sri Lanka
-
 Sweden
-
 Switzerland
-
 Syria
-
 Taiwan
-
 Tajikistan
-
 Tanzania
-
 Thailand
-
 Trinidad and Tobago
-
 Tunisia
-
 Turkey
-
 UAE
-
 Uganda
-
 Ukraine
-
 United Kingdom
-
United States
-
 Uruguay
-
 Uzbekistan
-
 Venezuela
-
 Vietnam
-
 Yemen
-
 Zambia
-
 Zimbabwe
- Forex
- Crypto












