

LULU slides around 3.5% as technicals show bearish momentum and weak North American results

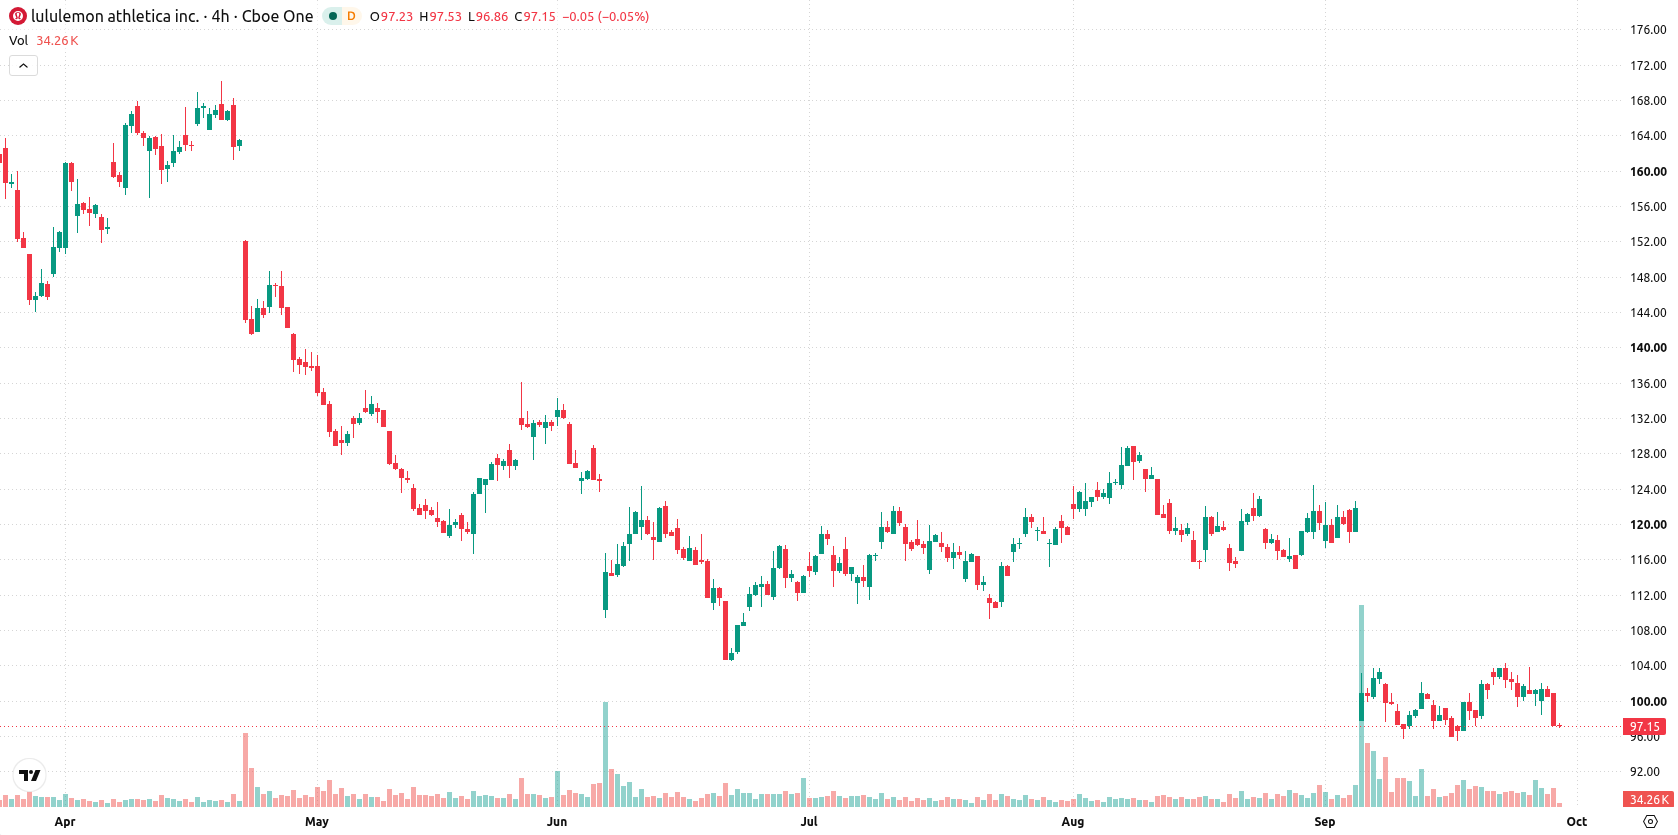
Lululemon Athletica Inc. (LULU) slid 3.46% after reporting modest revenue growth in its latest results, as continued North American sales weakness and lackluster product launches pointed to persistent demand challenges. The down move is supported by the stock's position below all major moving averages, reflecting sustained selling pressure and a still-bearish technical structure.
 111.62
Highlights
- Lululemon Athletica reported modest overall revenue growth for Q1 2026 as China Mainland revenue rose 30% and comparable sales increased 13%.
- North American sales fell, and customer traffic declined due to negative social media coverage and underperforming product launches.
- Shares of Lululemon stock are under bearish pressure, trading below key moving averages with a projected 5-day range of $93.89 to $99.8.
Chinese growth offsets weak regions as sentiment sours and new leadership acts
Lululemon Athletica reported modest revenue growth for Q1 2026, mainly driven by a 30% increase in China Mainland revenue and a 13% rise in comparable sales helped by Chinese New Year timing. Revenue in the 'Rest of World' segment rose 13%, but North American sales declined in the same period. Recent product innovation efforts included some underperforming launches, and negative social media coverage weakened customer traffic. Leadership transitions introduced new executives focusing on growth and product excellence, though price action has remained under broader selling pressure.
Bearish momentum strengthens as price remains below all technical levels
Lululemon Athletica is trading below its 20-day moving average at $104.01, 50-day at $113.37, and 200-day at $146.96, confirming persistent selling pressure across all timeframes. The Ichimoku Kijun at $109.72 is well above the current price, acting as distant resistance, while the near-term ceiling is $97.66 and the near-term floor is $93.89. Momentum readings are decisively bearish. The Moving Average Convergence Divergence (MACD) and Average Directional Index (ADX) both signal a strong downward trend. The Relative Strength Index (RSI) is soft at 41.09 with a sell signal, while the Stochastic RSI is neutral at 76 and the Commodity Channel Index (CCI) is also neutral, reflecting some loss of downside momentum but not yet signaling a reversal. Bull/Bear Power (BBP) is negative, showing sellers are in control and the forecast is oversold. The daily movement reflects this picture, as the stock is trading at $97.1 after slipping 3.46% today, opening with a downside gap of roughly 0.33%. Price is near the session low and intraday volatility stands at 2.90%. The tone is one of heavy pressure after the open, and these dynamics reinforce the bearish momentum readings.
Previously it was reported that On Holding sought to boost its global presence and challenge category leaders by signing Kylian Mbappe, reflecting how athletic brands use high-profile endorsements and sport expansions to address slowing growth. In contrast, Lululemon's latest results underscore persistent North American weakness and product challenges, positioning the $93.89 level as a critical downside risk to monitor in the coming days.






Latest Lululemon Athletica News





-
 Afghanistan
-
 Albania
-
 Algeria
-
 Angola
-
 Argentina
-
 Armenia
-
 Australia
-
 Austria
-
 Azerbaijan
-
 Bahamas
-
 Bahrain
-
 Bangladesh
-
 Belarus
-
 Belgium
-
 Bolivia
-
 Botswana
-
 Brazil
-
 Brunei
-
 Bulgaria
-
 Cambodia
-
 Cameroon
-
 Canada
-
 Chile
-
 China
-
 Colombia
-
 Congo
-
 Costa Rica
-
 Cote d'Ivoire
-
 Croatia
-
 Cuba
-
 Cyprus
-
 Czechia
-
 DR Congo
-
 Denmark
-
 Dominican Republic
-
 Ecuador
-
 Egypt
-
 El Salvador
-
 Estonia
-
 Eswatini
-
 Ethiopia
-
 Finland
-
 France
-
 Georgia
-
 Germany
-
 Ghana
-
 Greece
-
 Haiti
-
 Hong Kong
-
 Hungary
-
 India
-
 Indonesia
-
 Iran, Islamic republic
-
 Iraq
-
 Ireland
-
 Israel
-
 Italy
-
 Jamaica
-
 Japan
-
 Jordan
-
 Kazakhstan
-
 Kenya
-
 Korea
-
 Kuwait
-
 Kyrgyzstan
-
 Laos
-
 Latvia
-
 Lebanon
-
 Lesotho
-
 Libya
-
 Lithuania
-
 Luxembourg
-
 Madagascar
-
 Malaysia
-
 Malta
-
 Mauritius
-
 Mexico
-
 Moldova
-
 Mongolia
-
 Montenegro
-
 Morocco
-
 Mozambique
-
 Myanmar
-
 Namibia
-
 Nepal
-
 Netherlands
-
 New Zealand
-
 Nigeria
-
 North Macedonia
-
 Norway
-
 Oman
-
 Pakistan
-
 Palestine
-
 Panama
-
 Papua New Guinea
-
 Paraguay
-
 Peru
-
 Philippines
-
 Poland
-
 Portugal
-
 Puerto Rico
-
 Qatar
-
 Reunion
-
 Romania
-
 Rwanda
-
 Saudi Arabia
-
 Serbia
-
 Singapore
-
 Slovakia
-
 Slovenia
-
 Somalia
-
 South Africa
-
 Spain
-
 Sri Lanka
-
 Sweden
-
 Switzerland
-
 Syria
-
 Taiwan
-
 Tajikistan
-
 Tanzania
-
 Thailand
-
 Trinidad and Tobago
-
 Tunisia
-
 Turkey
-
 UAE
-
 Uganda
-
 Ukraine
-
 United Kingdom
-
United States
-
 Uruguay
-
 Uzbekistan
-
 Venezuela
-
 Vietnam
-
 Yemen
-
 Zambia
-
 Zimbabwe
- Forex
- Crypto












