

Eli Lilly reports robust Q2 results: Can LLY sustain its upward momentum?

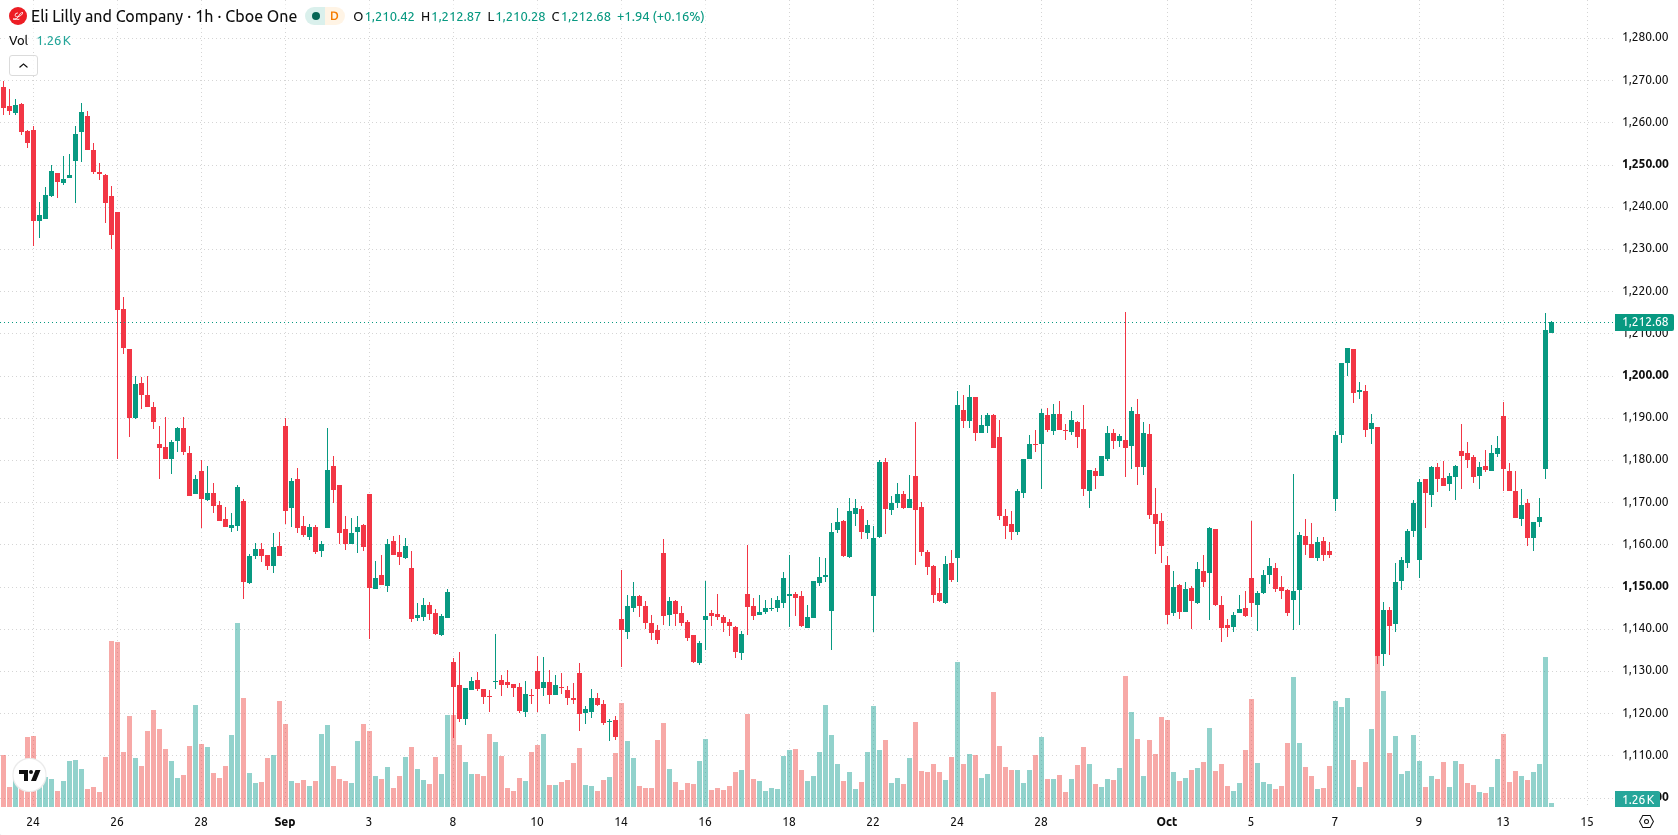
Eli Lilly (LLY) stock is trading at $1,210, up 3.79% on the day, and holding above its key moving averages.
 1374.02
1449.69
Highlights
- Eli Lilly reported quarterly revenue of $22.97 billion and net profit of $7.1 billion for the period ended June 30.
- Diabetes and obesity drug franchises provided the main support for continued strong demand and robust financial results.
- Shares of Eli Lilly trade in a bullish structure above key moving averages, with the next range expected between $1,152 to $1,238 based on mixed momentum signals.
Blockbuster drug sales bolster earnings and lift investor sentiment
Eli Lilly recently reported revenue of $22.97 billion and net profit of $7.1 billion for the quarter ended June 30, according to Theglobeandmail. These results highlight robust performance, attributing strength to its successful diabetes and obesity drug franchises, which continue to underpin demand. The strong earnings outcome solidifies positive sentiment around the stock, as markets digest the impact of these blockbuster products.
Bearish momentum signals emerge amid strong price support levels
LLY is trading above its MA-20 at $1,174 and MA-50 at $1,168 on the h1 timeframe, with a wide margin over the MA-200 at $1,077 on the daily chart. The Ichimoku Kijun at $1,166 acts as immediate support. Momentum readings are conflicted: MACD and ADX are neutral, RSI is at 46.04 (Sell), and both CCI and Bull/Bear Power register as oversold, while Stochastic RSI is neutral. Bearish signals from RSI, CCI, Bull/Bear Power, and AO suggest sellers maintain near-term control despite a strong intraday performance and a 24.19-point opening gap.
Consolidation expected as upside scenario outweighs downside risk
In the short term, LLY is expected to trade within a $1,152–$1,238 volatility band relative to current levels. The probability of an upward move is very high, with a downside move being very unlikely. The base scenario calls for price consolidation within this range; a confirmed breakout above $1,238 would initiate a bullish scenario, while a decline below $1,152 would indicate the start of a bearish phase.
Earlier, analysts noted that Eli Lilly shares were consolidating as the company expanded its pipeline through strategic partnerships, with the near-term outlook hinging on support levels and potential catalysts. The latest earnings results and current price action strengthen that view, as traders should now monitor the $1,238 threshold for signs of a possible breakout or reversal in the prevailing consolidation scenario.






Latest Eli Lilly and Company News




-
 Afghanistan
-
 Albania
-
 Algeria
-
 Angola
-
 Argentina
-
 Armenia
-
 Australia
-
 Austria
-
 Azerbaijan
-
 Bahamas
-
 Bahrain
-
 Bangladesh
-
 Belarus
-
 Belgium
-
 Bolivia
-
 Botswana
-
 Brazil
-
 Brunei
-
 Bulgaria
-
 Cambodia
-
 Cameroon
-
 Canada
-
 Chile
-
 China
-
 Colombia
-
 Congo
-
 Costa Rica
-
 Cote d'Ivoire
-
 Croatia
-
 Cuba
-
 Cyprus
-
 Czechia
-
 DR Congo
-
 Denmark
-
 Dominican Republic
-
 Ecuador
-
 Egypt
-
 El Salvador
-
 Estonia
-
 Eswatini
-
 Ethiopia
-
 Finland
-
 France
-
 Georgia
-
 Germany
-
 Ghana
-
 Greece
-
 Haiti
-
 Hong Kong
-
 Hungary
-
 India
-
 Indonesia
-
 Iran, Islamic republic
-
 Iraq
-
 Ireland
-
 Israel
-
 Italy
-
 Jamaica
-
 Japan
-
 Jordan
-
 Kazakhstan
-
 Kenya
-
 Korea
-
 Kuwait
-
 Kyrgyzstan
-
 Laos
-
 Latvia
-
 Lebanon
-
 Lesotho
-
 Libya
-
 Lithuania
-
 Luxembourg
-
 Madagascar
-
 Malaysia
-
 Malta
-
 Mauritius
-
 Mexico
-
 Moldova
-
 Mongolia
-
 Montenegro
-
 Morocco
-
 Mozambique
-
 Myanmar
-
 Namibia
-
 Nepal
-
 Netherlands
-
 New Zealand
-
 Nigeria
-
 North Macedonia
-
 Norway
-
 Oman
-
 Pakistan
-
 Palestine
-
 Panama
-
 Papua New Guinea
-
 Paraguay
-
 Peru
-
 Philippines
-
 Poland
-
 Portugal
-
 Puerto Rico
-
 Qatar
-
 Reunion
-
 Romania
-
 Rwanda
-
 Saudi Arabia
-
 Serbia
-
 Singapore
-
 Slovakia
-
 Slovenia
-
 Somalia
-
 South Africa
-
 Spain
-
 Sri Lanka
-
 Sweden
-
 Switzerland
-
 Syria
-
 Taiwan
-
 Tajikistan
-
 Tanzania
-
 Thailand
-
 Trinidad and Tobago
-
 Tunisia
-
 Turkey
-
 UAE
-
 Uganda
-
 Ukraine
-
 United Kingdom
-
United States
-
 Uruguay
-
 Uzbekistan
-
 Venezuela
-
 Vietnam
-
 Yemen
-
 Zambia
-
 Zimbabwe
- Forex
- Crypto












