

Strategy shares technical analysis: Persistent seller control with price approaching $140.06 support

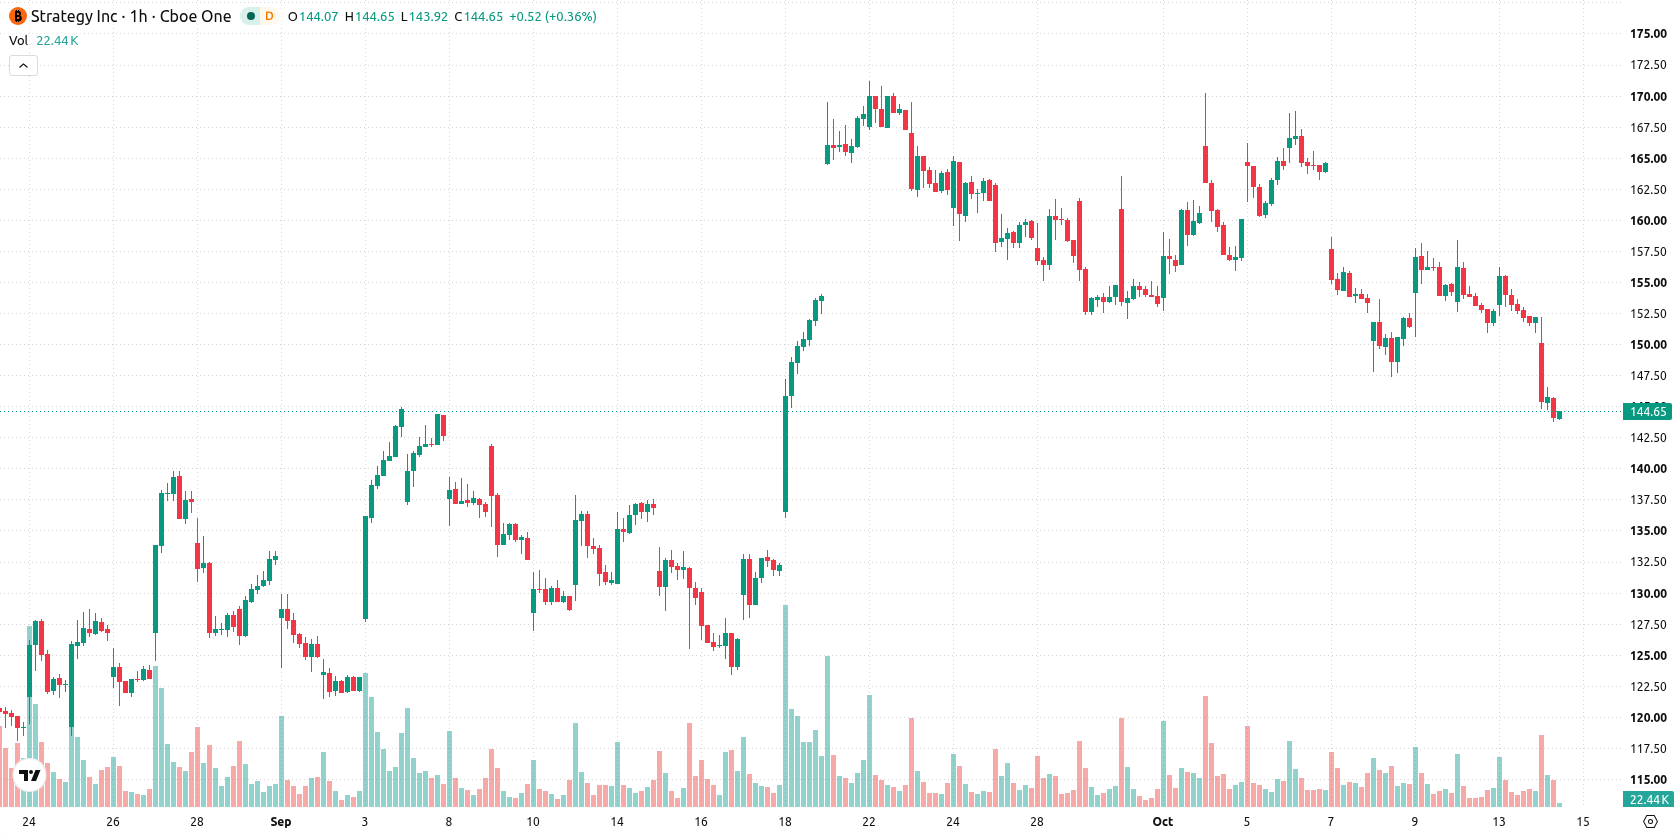
Strategy (MSTR, formerly MicroStrategy) stock is trading at $144.89, down 4.79% on the day. The shares are positioned below key moving averages, reflecting pronounced short- and medium-term weakness, but remain above long-term support zones.
 141.10
156.14
Highlights
- Strategy allocated $192.4 million to repurchase preferred shares and $21.5 million to buy 250 bitcoins in early October 2026.
- Last quarter's loss was smaller than forecast, with EPS of -$2.189 versus a larger expected deficit.
- Shares trade below short- and medium-term moving averages as bearish momentum persists, with the expected range at $140.06 to $151.69 and a 76% probability of further downside.
Buybacks and bitcoin purchases shift risk as downside pressure lingers
Strategy executed $192.4 million in buybacks of its STRC preferred shares and invested $21.5 million to acquire 250 bitcoins between October 5 and 11, 2026, according to CryptoSlate. This substantial allocation of capital reduced the preferred share float and modestly increased digital asset exposure, affecting the company’s risk profile and resource flexibility. Additional context came from a better-than-expected loss last quarter, with EPS of -$2.189 versus market forecasts of a much steeper deficit, as reported by Tipranks. Despite these recent actions, price action has remained under broader selling pressure.
Bearish signals and oversold readings as momentum diverges
The technical structure for MSTR shows price below the MA-20 at $153.88 and MA-50 at $156.53, while remaining above the long-term MA-200 at $135.8. Immediate resistance stands at the Ichimoku Kijun level of $152.89. Momentum indicators reinforce a negative bias: MACD points to a sell signal, ADX remains neutral indicating low trend strength, and RSI sits at 43.76 (Sell). Both CCI and Bull/Bear Power reflect oversold conditions, confirming persistent seller control, though Stoch RSI displays a strong buy, highlighting a possible short-term oversold bounce. The Awesome Oscillator continues to indicate bearish momentum, and today's session featured high volatility with a gap open and a close near the session low. A notable divergence emerges between deep oversold oscillator readings and ongoing downward momentum.
High downside risk persists as volatility shapes consolidation range
Looking ahead, the most likely scenario is for MSTR to consolidate within the $140.06–$151.69 range amid continued volatility. The probability of further downside remains high at 76%, with only a 24% chance of a sustained upward move in the near term. A clear break above the Ichimoku Kijun resistance at $152.89 would open the way for a short-term bullish reversal, while a close below the $140.06 support could accelerate further losses. Market participants should closely monitor volatility and confirmation of support and resistance levels to gauge short-term direction.
Earlier, analysts noted that Strategy's ongoing Bitcoin acquisitions and preferred share buybacks underpinned a broadly constructive outlook for its digital asset strategy. In the current context, however, the prevailing technical weakness and persistent selling pressure signal an increased risk of a downside break below $140.06, making this support level critical to watch in the near term.





Latest Strategy News





-
 Afghanistan
-
 Albania
-
 Algeria
-
 Angola
-
 Argentina
-
 Armenia
-
 Australia
-
 Austria
-
 Azerbaijan
-
 Bahamas
-
 Bahrain
-
 Bangladesh
-
 Belarus
-
 Belgium
-
 Bolivia
-
 Botswana
-
 Brazil
-
 Brunei
-
 Bulgaria
-
 Cambodia
-
 Cameroon
-
 Canada
-
 Chile
-
 China
-
 Colombia
-
 Congo
-
 Costa Rica
-
 Cote d'Ivoire
-
 Croatia
-
 Cuba
-
 Cyprus
-
 Czechia
-
 DR Congo
-
 Denmark
-
 Dominican Republic
-
 Ecuador
-
 Egypt
-
 El Salvador
-
 Estonia
-
 Eswatini
-
 Ethiopia
-
 Finland
-
 France
-
 Georgia
-
 Germany
-
 Ghana
-
 Greece
-
 Haiti
-
 Hong Kong
-
 Hungary
-
 India
-
 Indonesia
-
 Iran, Islamic republic
-
 Iraq
-
 Ireland
-
 Israel
-
 Italy
-
 Jamaica
-
 Japan
-
 Jordan
-
 Kazakhstan
-
 Kenya
-
 Korea
-
 Kuwait
-
 Kyrgyzstan
-
 Laos
-
 Latvia
-
 Lebanon
-
 Lesotho
-
 Libya
-
 Lithuania
-
 Luxembourg
-
 Madagascar
-
 Malaysia
-
 Malta
-
 Mauritius
-
 Mexico
-
 Moldova
-
 Mongolia
-
 Montenegro
-
 Morocco
-
 Mozambique
-
 Myanmar
-
 Namibia
-
 Nepal
-
 Netherlands
-
 New Zealand
-
 Nigeria
-
 North Macedonia
-
 Norway
-
 Oman
-
 Pakistan
-
 Palestine
-
 Panama
-
 Papua New Guinea
-
 Paraguay
-
 Peru
-
 Philippines
-
 Poland
-
 Portugal
-
 Puerto Rico
-
 Qatar
-
 Reunion
-
 Romania
-
 Rwanda
-
 Saudi Arabia
-
 Serbia
-
 Singapore
-
 Slovakia
-
 Slovenia
-
 Somalia
-
 South Africa
-
 Spain
-
 Sri Lanka
-
 Sweden
-
 Switzerland
-
 Syria
-
 Taiwan
-
 Tajikistan
-
 Tanzania
-
 Thailand
-
 Trinidad and Tobago
-
 Tunisia
-
 Turkey
-
 UAE
-
 Uganda
-
 Ukraine
-
 United Kingdom
-
United States
-
 Uruguay
-
 Uzbekistan
-
 Venezuela
-
 Vietnam
-
 Yemen
-
 Zambia
-
 Zimbabwe
- Forex
- Crypto












