

RIOT slumps nearly 11% as stock remains below key moving averages and faces strong resistance

Riot Platforms, Inc. (RIOT) dropped 10.65% as intensified selling pressure and firmly negative momentum signals drove a decisive bearish move. The decline is reinforced by the stock remaining below all significant moving averages and capped by major technical resistance.
 15.15
16.91
Highlights
- Shares of Riot Platforms fell 10.65% to $14.9, trading near the intraday low with increased volatility.
- The stock is trading below key moving averages across all timeframes and faces persistent selling pressure.
- Technical indicators register oversold conditions and forecast a 77% probability of a move to $13.67, with $16.13 as resistance.
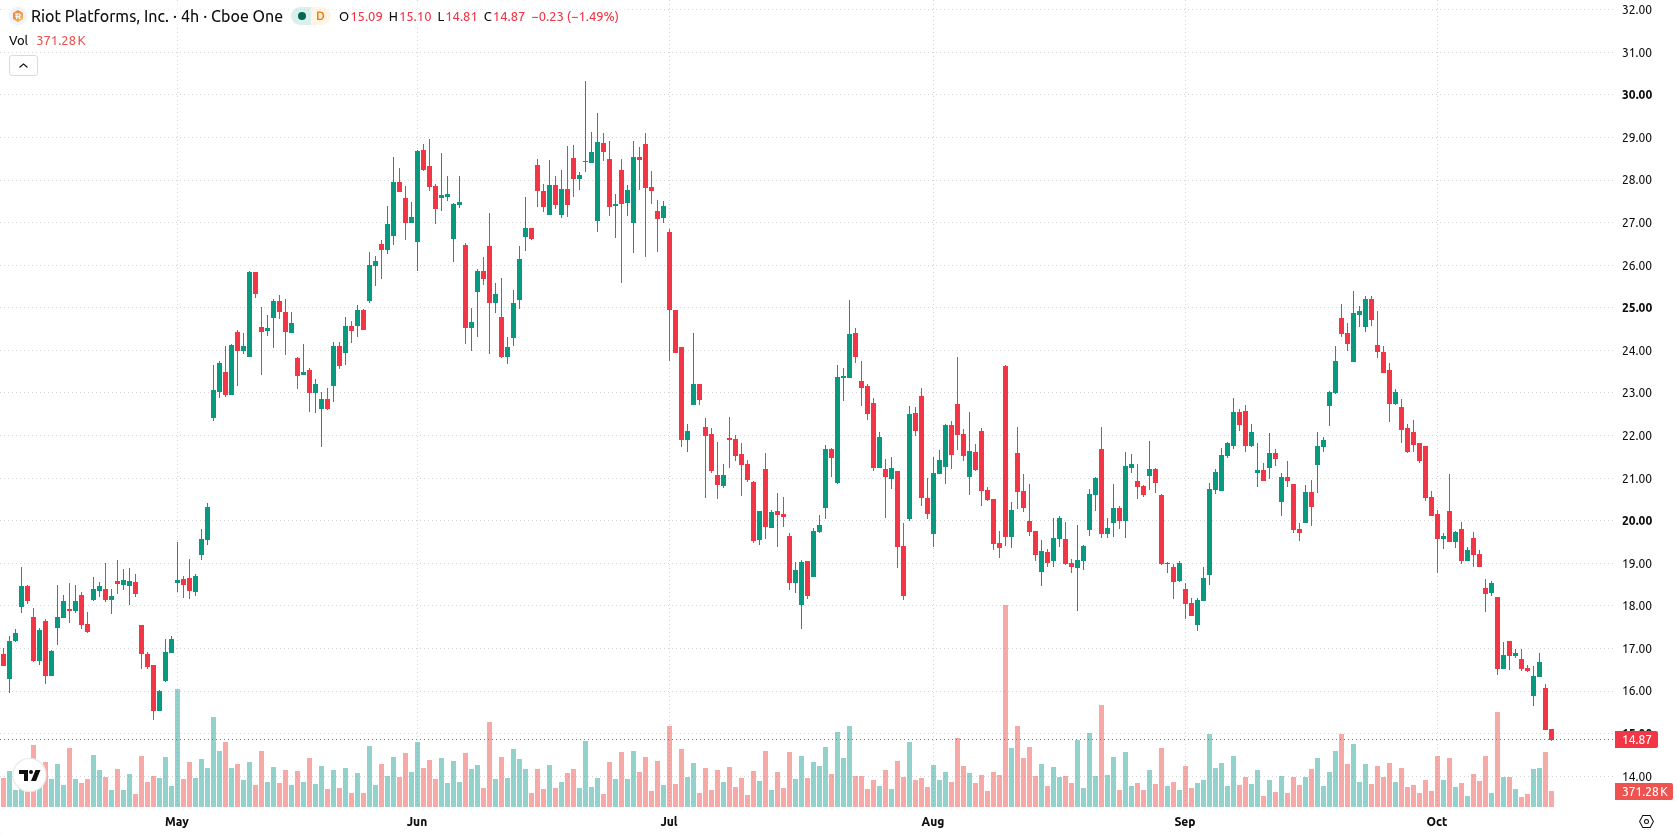
Decisively negative signals as support holds and volatility surges
RIOT is trading below its 20-day, 50-day, and 200-day moving averages ($20.63, $20.44, and $19.47), and remains capped beneath the Ichimoku Kijun at $20.49, reflecting sustained selling pressure across all key timeframes. Immediate technical levels are identified at a resistance of $15.23 and support at $13.67. Despite the current weakness, the broader trend is still technically bullish based on the MA-50 remaining above the MA-200. Momentum indicators are decisively negative: the MACD issues a sell signal, ADX is neutral at 13.5 but confirms a weak downtrend, and intraday oscillators show pronounced oversold conditions. The RSI reads 32.25 (sell), the CCI is oversold at -123.6, and the Stochastic RSI is extremely low at 5.42. Bear/Bull Power signals strong intraday selling dominance at -1.87. The Awesome Oscillator forecasts additional downside risk, and intraday volatility is high, with the price close to session lows after a broad downside gap.
Earlier, analysts noted that Riot Platforms was displaying sustained technical weakness and persistent downward momentum. This latest analysis reinforces that bearish outlook with even stronger negative momentum signals, highlighting $13.67 as the key support level to monitor for potential further downside risk.








-
 Afghanistan
-
 Albania
-
 Algeria
-
 Angola
-
 Argentina
-
 Armenia
-
 Australia
-
 Austria
-
 Azerbaijan
-
 Bahamas
-
 Bahrain
-
 Bangladesh
-
 Belarus
-
 Belgium
-
 Bolivia
-
 Botswana
-
 Brazil
-
 Brunei
-
 Bulgaria
-
 Cambodia
-
 Cameroon
-
 Canada
-
 Chile
-
 China
-
 Colombia
-
 Congo
-
 Costa Rica
-
 Cote d'Ivoire
-
 Croatia
-
 Cuba
-
 Cyprus
-
 Czechia
-
 DR Congo
-
 Denmark
-
 Dominican Republic
-
 Ecuador
-
 Egypt
-
 El Salvador
-
 Estonia
-
 Eswatini
-
 Ethiopia
-
 Finland
-
 France
-
 Georgia
-
 Germany
-
 Ghana
-
 Greece
-
 Haiti
-
 Hong Kong
-
 Hungary
-
 India
-
 Indonesia
-
 Iran, Islamic republic
-
 Iraq
-
 Ireland
-
 Israel
-
 Italy
-
 Jamaica
-
 Japan
-
 Jordan
-
 Kazakhstan
-
 Kenya
-
 Korea
-
 Kuwait
-
 Kyrgyzstan
-
 Laos
-
 Latvia
-
 Lebanon
-
 Lesotho
-
 Libya
-
 Lithuania
-
 Luxembourg
-
 Madagascar
-
 Malaysia
-
 Malta
-
 Mauritius
-
 Mexico
-
 Moldova
-
 Mongolia
-
 Montenegro
-
 Morocco
-
 Mozambique
-
 Myanmar
-
 Namibia
-
 Nepal
-
 Netherlands
-
 New Zealand
-
 Nigeria
-
 North Macedonia
-
 Norway
-
 Oman
-
 Pakistan
-
 Palestine
-
 Panama
-
 Papua New Guinea
-
 Paraguay
-
 Peru
-
 Philippines
-
 Poland
-
 Portugal
-
 Puerto Rico
-
 Qatar
-
 Reunion
-
 Romania
-
 Rwanda
-
 Saudi Arabia
-
 Serbia
-
 Singapore
-
 Slovakia
-
 Slovenia
-
 Somalia
-
 South Africa
-
 Spain
-
 Sri Lanka
-
 Sweden
-
 Switzerland
-
 Syria
-
 Taiwan
-
 Tajikistan
-
 Tanzania
-
 Thailand
-
 Trinidad and Tobago
-
 Tunisia
-
 Turkey
-
 UAE
-
 Uganda
-
 Ukraine
-
 United Kingdom
-
United States
-
 Uruguay
-
 Uzbekistan
-
 Venezuela
-
 Vietnam
-
 Yemen
-
 Zambia
-
 Zimbabwe
- Forex
- Crypto












