

ASTS drops as downward price move reflects strong seller control

AST SpaceMobile (ASTS) stock is trading at $40.66, marking a daily decline of 8.75%. The price is positioned below its key moving averages, indicating notable downside pressure.
 42.18
44.82
Highlights
- AST SpaceMobile completed its first integration test with TELUS, enabling direct smartphone-to-space connectivity and confirming technical feasibility for future service expansion.
- The company reported Q1 2026 revenue of $14.7 million, showing initial commercial traction despite facing a securities class action lawsuit regarding capital needs and competitive positioning.
- Shares of AST SpaceMobile trade below major moving averages with technical signals unified on a bearish trend, projecting a price range of $34.15 to $47.17 over the next 2 to 3 days.
Operational milestone boosts commercial prospects despite litigation risks
AST SpaceMobile has completed its first integration test with TELUS, successfully linking its satellite network to TELUS infrastructure to enable direct smartphone-to-space connectivity, according to Simplywall. This operational milestone demonstrates technical feasibility for broader service rollout and may signal partnership opportunities with established telecom providers. The company reported Q1 2026 revenue of $14.7 million, disclosing early commercial traction, while continuing to face a securities class action lawsuit alleging misstatements on capital needs and competitive positioning, as reported by Prnewswire.
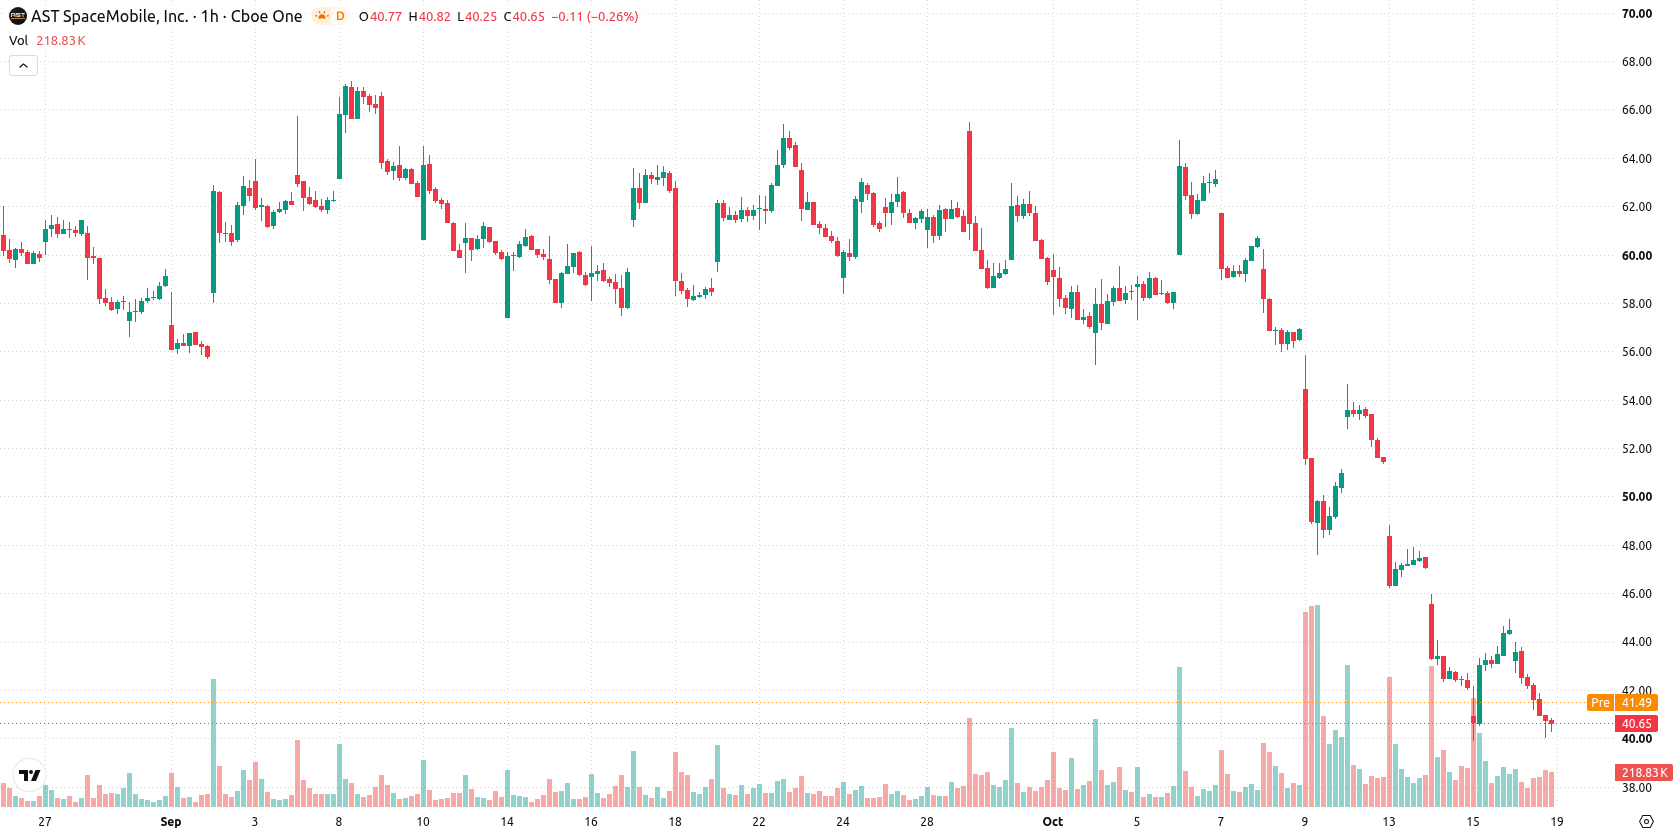
Bearish momentum builds as price breaches major moving averages
On the hourly chart, ASTS trades below the MA-20 and MA-50, with price remaining significantly beneath the MA-200 on the daily timeframe. Immediate resistance is defined by the Ichimoku Kijun at $43.89. Momentum indicators reinforce the bearish setup: the MACD signals strong sell, ADX highlights trend weakness, and the Awesome Oscillator aligns with intraday downside momentum. RSI prints at 29.11 and CCI is in oversold territory, both indicating sustained selling pressure, while Stoch RSI is neutral. Intraday action is dominated by sellers as confirmed by Bear/Bull Power readings.
Downside risk prevails as breakout or breakdown levels defined
Over the next two to three trading days, the projected price band for ASTS is $34.15 to $47.17, reflecting typical volatility seen amid current technical conditions. The probability of an upward price reversal is assessed as very low, with downside risk dominating. The base case scenario is for consolidation within this corridor; a break above $43.89 would open the door to a bullish move, while a fall through $34.15 would confirm further deterioration.
Earlier, analysts noted that AST SpaceMobile faced persistent downside risk driven by technical weakness and ongoing legal uncertainties. The current article reinforces this cautious outlook as sustained selling pressure and lack of upside momentum place the focus on $34.15 as the critical support level to monitor for potential further declines.









-
 Afghanistan
-
 Albania
-
 Algeria
-
 Angola
-
 Argentina
-
 Armenia
-
 Australia
-
 Austria
-
 Azerbaijan
-
 Bahamas
-
 Bahrain
-
 Bangladesh
-
 Belarus
-
 Belgium
-
 Bolivia
-
 Botswana
-
 Brazil
-
 Brunei
-
 Bulgaria
-
 Cambodia
-
 Cameroon
-
 Canada
-
 Chile
-
 China
-
 Colombia
-
 Congo
-
 Costa Rica
-
 Cote d'Ivoire
-
 Croatia
-
 Cuba
-
 Cyprus
-
 Czechia
-
 DR Congo
-
 Denmark
-
 Dominican Republic
-
 Ecuador
-
 Egypt
-
 El Salvador
-
 Estonia
-
 Eswatini
-
 Ethiopia
-
 Finland
-
 France
-
 Georgia
-
 Germany
-
 Ghana
-
 Greece
-
 Haiti
-
 Hong Kong
-
 Hungary
-
 India
-
 Indonesia
-
 Iran, Islamic republic
-
 Iraq
-
 Ireland
-
 Israel
-
 Italy
-
 Jamaica
-
 Japan
-
 Jordan
-
 Kazakhstan
-
 Kenya
-
 Korea
-
 Kuwait
-
 Kyrgyzstan
-
 Laos
-
 Latvia
-
 Lebanon
-
 Lesotho
-
 Libya
-
 Lithuania
-
 Luxembourg
-
 Madagascar
-
 Malaysia
-
 Malta
-
 Mauritius
-
 Mexico
-
 Moldova
-
 Mongolia
-
 Montenegro
-
 Morocco
-
 Mozambique
-
 Myanmar
-
 Namibia
-
 Nepal
-
 Netherlands
-
 New Zealand
-
 Nigeria
-
 North Macedonia
-
 Norway
-
 Oman
-
 Pakistan
-
 Palestine
-
 Panama
-
 Papua New Guinea
-
 Paraguay
-
 Peru
-
 Philippines
-
 Poland
-
 Portugal
-
 Puerto Rico
-
 Qatar
-
 Reunion
-
 Romania
-
 Rwanda
-
 Saudi Arabia
-
 Serbia
-
 Singapore
-
 Slovakia
-
 Slovenia
-
 Somalia
-
 South Africa
-
 Spain
-
 Sri Lanka
-
 Sweden
-
 Switzerland
-
 Syria
-
 Taiwan
-
 Tajikistan
-
 Tanzania
-
 Thailand
-
 Trinidad and Tobago
-
 Tunisia
-
 Turkey
-
 UAE
-
 Uganda
-
 Ukraine
-
 United Kingdom
-
United States
-
 Uruguay
-
 Uzbekistan
-
 Venezuela
-
 Vietnam
-
 Yemen
-
 Zambia
-
 Zimbabwe
- Forex
- Crypto












