

Will Meta stock hold above $670.39 support amid seller pressure and flat price action?

Meta (META) stock is trading at $704.95, with a modest decline on the day. The price remains below its primary short- and medium-term moving averages, while holding above longer-term levels.
 706.82
753.13
Highlights
- META/USD closed at $704.95, falling 0.65% with a negative gap of 2.43, indicating short-term downside risk.
- Bearish momentum prevails as the price trades below key short- and medium-term moving averages while staying above longer-term support.
- Price is expected to move between $670.39 and $739.51 over the next several days, with a 71% chance of further downside.
Bearish momentum intensifies as daily resistance curbs upside
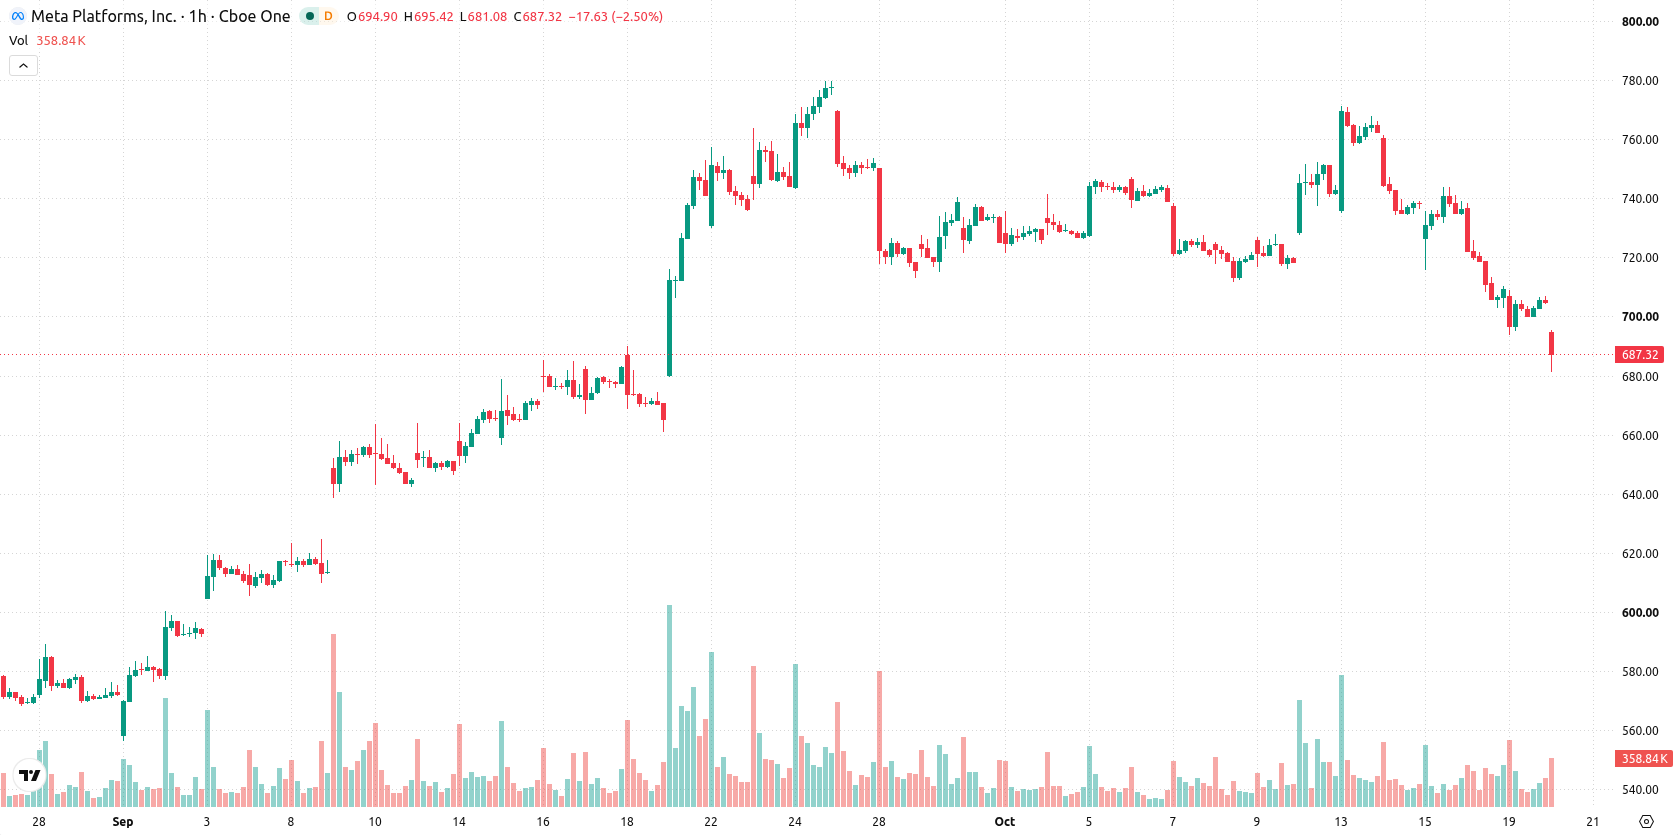
On the technical front, META is positioned below the MA-20 at $716.41 and the MA-50 at $732.41, pointing to sustained selling pressure in the near and medium term, while the MA-200 at $632.18 remains a significant longer-term support. The Ichimoku Kijun level on the daily chart is set at $718.92 and functions as immediate resistance for potential upside tests. On the hourly timeframe, both MACD and ADX confirm ongoing bearish momentum. RSI and CCI are both indicating a sell bias, though Stochastic RSI is overbought as Bull/Bear Power is classified as oversold, capturing a divergence in short-term sentiment and suggesting ongoing intraday indecision despite a predominance of sellers.
Downside risk dominates as support levels define volatility band
In the near term, price action is expected to consolidate between $670.39 and $739.51, defining the likely volatility band relative to current levels. The calculated probability of an upward breakout stands at 29%, while a downside move is favored at 71%, reflecting a greater risk of further losses if immediate support fails. Should resistance above $718.92 be breached decisively, a rebound toward the higher end of the range would come into play. Conversely, loss of the $670.39 support may open the way for accelerated declines.
Earlier, analysts noted that Meta’s expanding AI infrastructure investments could shift its revenue mix and introduce new operational risks. The present technical setup, with a dominant downside probability and pronounced short-term bearish signals, highlights the importance of monitoring the $670.39 support as a trigger for accelerated losses.





Latest META News




-
 Afghanistan
-
 Albania
-
 Algeria
-
 Angola
-
 Argentina
-
 Armenia
-
 Australia
-
 Austria
-
 Azerbaijan
-
 Bahamas
-
 Bahrain
-
 Bangladesh
-
 Belarus
-
 Belgium
-
 Bolivia
-
 Botswana
-
 Brazil
-
 Brunei
-
 Bulgaria
-
 Cambodia
-
 Cameroon
-
 Canada
-
 Chile
-
 China
-
 Colombia
-
 Congo
-
 Costa Rica
-
 Cote d'Ivoire
-
 Croatia
-
 Cuba
-
 Cyprus
-
 Czechia
-
 DR Congo
-
 Denmark
-
 Dominican Republic
-
 Ecuador
-
 Egypt
-
 El Salvador
-
 Estonia
-
 Eswatini
-
 Ethiopia
-
 Finland
-
 France
-
 Georgia
-
 Germany
-
 Ghana
-
 Greece
-
 Haiti
-
 Hong Kong
-
 Hungary
-
 India
-
 Indonesia
-
 Iran, Islamic republic
-
 Iraq
-
 Ireland
-
 Israel
-
 Italy
-
 Jamaica
-
 Japan
-
 Jordan
-
 Kazakhstan
-
 Kenya
-
 Korea
-
 Kuwait
-
 Kyrgyzstan
-
 Laos
-
 Latvia
-
 Lebanon
-
 Lesotho
-
 Libya
-
 Lithuania
-
 Luxembourg
-
 Madagascar
-
 Malaysia
-
 Malta
-
 Mauritius
-
 Mexico
-
 Moldova
-
 Mongolia
-
 Montenegro
-
 Morocco
-
 Mozambique
-
 Myanmar
-
 Namibia
-
 Nepal
-
 Netherlands
-
 New Zealand
-
 Nigeria
-
 North Macedonia
-
 Norway
-
 Oman
-
 Pakistan
-
 Palestine
-
 Panama
-
 Papua New Guinea
-
 Paraguay
-
 Peru
-
 Philippines
-
 Poland
-
 Portugal
-
 Puerto Rico
-
 Qatar
-
 Reunion
-
 Romania
-
 Rwanda
-
 Saudi Arabia
-
 Serbia
-
 Singapore
-
 Slovakia
-
 Slovenia
-
 Somalia
-
 South Africa
-
 Spain
-
 Sri Lanka
-
 Sweden
-
 Switzerland
-
 Syria
-
 Taiwan
-
 Tajikistan
-
 Tanzania
-
 Thailand
-
 Trinidad and Tobago
-
 Tunisia
-
 Turkey
-
 UAE
-
 Uganda
-
 Ukraine
-
 United Kingdom
-
United States
-
 Uruguay
-
 Uzbekistan
-
 Venezuela
-
 Vietnam
-
 Yemen
-
 Zambia
-
 Zimbabwe
- Forex
- Crypto












