

Can TSLA hold $358.68 support amid rising expenses and compressed margins?

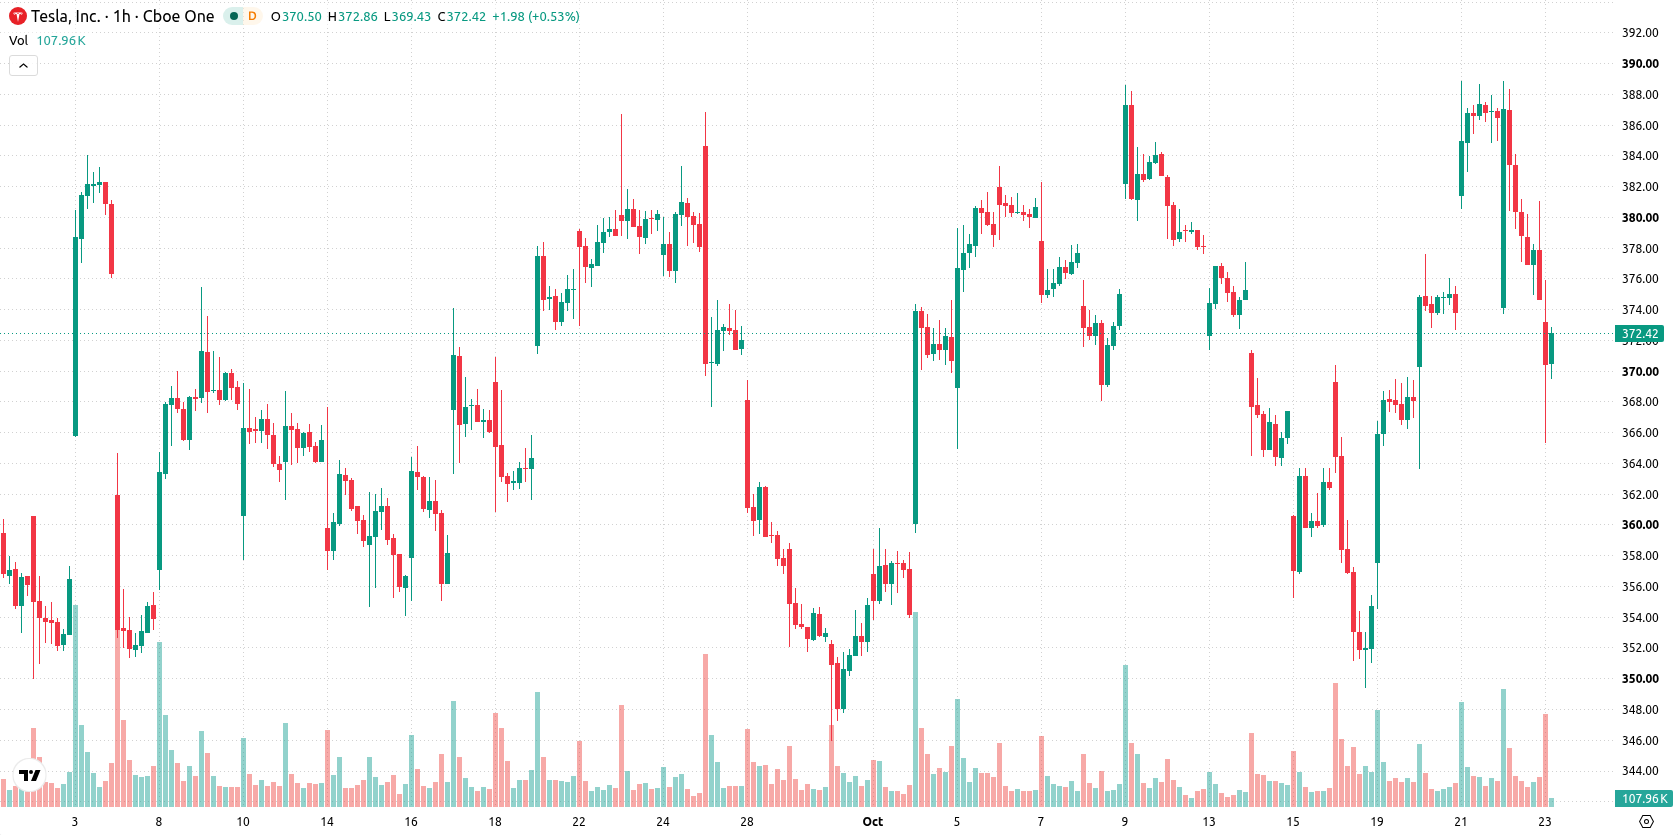
Tesla (TSLA) stock is trading at $369.1, marking a decline of 1.5% for the day. The price currently sits below its key moving averages, reflecting continued pressure from the seller side.
 382.20
402.16
Highlights
- Tesla stock reported third-quarter 2026 earnings per share of $0.48 and profit of $787 million, a 43% year-over-year decline.
- The company lowered its 2026 capital expenditure guidance to $20 billion from over $25 billion, indicating a reduced investment plan.
- Shares trade below key moving averages with most technical signals biased to sell and a high likelihood of a continued downward move toward the $358.68 to $379.52 range.
Profit margin compression and capex cuts fuel investor uncertainty
Tesla's third-quarter 2026 earnings report showed earnings per share of $0.48, surpassing consensus estimates, but revealed a 43% year-over-year decline in profit to $787 million as operating expenses rose. This margin compression, despite continued revenue strength at $28.05 billion, underscores growing cost pressures that are weighing on profitability and investor expectations. The company also lowered its 2026 capital expenditure guidance to $20 billion from over $25 billion, signaling a more cautious approach to future investment, according to MarketBeat. These developments contributed to increased uncertainty around the company's near-term prospects.
Divergent technical signals cap price below key resistance intraday
On the technical front, TSLA is trading below its MA-20 ($380.53), MA-50 ($369.75), and long-term MA-200 ($386.59) on the hourly chart, with the Ichimoku Kijun at $376.25 acting as immediate resistance. The indicator backdrop is divided: MACD signals strong buy, while ADX points to selling pressure. Both RSI and CCI lean bearish, while Stochastic RSI highlights oversold conditions. Bull/Bear Power registers as overbought, suggesting some buyer interest remains, but the Awesome Oscillator remains neutral. TSLA is positioned mid-range for the session, reflecting moderate volatility and a lack of decisive intraday momentum.
Renewed downside risk persists amid narrow range consolidation
In the short term, TSLA’s likely trading range is $358.68 to $379.52, reflecting the typical volatility band relative to current levels. The probability of a renewed upside move remains very low unless price breaks through immediate resistance near $376.25. The base case anticipates continued consolidation within this corridor, while a clear break below $358.68 would signal further downside and continuation of the prevailing downtrend.
Previously it was reported that merger speculation between Tesla and SpaceX was intensifying, with significant attention on potential structural and regulatory challenges. With Tesla now showing compressed margins and a lowered capex outlook, sustained technical resistance near $376.25 remains a key level to watch for signs of reversal or further downside risk.











-
 Afghanistan
-
 Albania
-
 Algeria
-
 Angola
-
 Argentina
-
 Armenia
-
 Australia
-
 Austria
-
 Azerbaijan
-
 Bahamas
-
 Bahrain
-
 Bangladesh
-
 Belarus
-
 Belgium
-
 Bolivia
-
 Botswana
-
 Brazil
-
 Brunei
-
 Bulgaria
-
 Cambodia
-
 Cameroon
-
 Canada
-
 Chile
-
 China
-
 Colombia
-
 Congo
-
 Costa Rica
-
 Cote d'Ivoire
-
 Croatia
-
 Cuba
-
 Cyprus
-
 Czechia
-
 DR Congo
-
 Denmark
-
 Dominican Republic
-
 Ecuador
-
 Egypt
-
 El Salvador
-
 Estonia
-
 Eswatini
-
 Ethiopia
-
 Finland
-
 France
-
 Georgia
-
 Germany
-
 Ghana
-
 Greece
-
 Haiti
-
 Hong Kong
-
 Hungary
-
 India
-
 Indonesia
-
 Iran, Islamic republic
-
 Iraq
-
 Ireland
-
 Israel
-
 Italy
-
 Jamaica
-
 Japan
-
 Jordan
-
 Kazakhstan
-
 Kenya
-
 Korea
-
 Kuwait
-
 Kyrgyzstan
-
 Laos
-
 Latvia
-
 Lebanon
-
 Lesotho
-
 Libya
-
 Lithuania
-
 Luxembourg
-
 Madagascar
-
 Malaysia
-
 Malta
-
 Mauritius
-
 Mexico
-
 Moldova
-
 Mongolia
-
 Montenegro
-
 Morocco
-
 Mozambique
-
 Myanmar
-
 Namibia
-
 Nepal
-
 Netherlands
-
 New Zealand
-
 Nigeria
-
 North Macedonia
-
 Norway
-
 Oman
-
 Pakistan
-
 Palestine
-
 Panama
-
 Papua New Guinea
-
 Paraguay
-
 Peru
-
 Philippines
-
 Poland
-
 Portugal
-
 Puerto Rico
-
 Qatar
-
 Reunion
-
 Romania
-
 Rwanda
-
 Saudi Arabia
-
 Serbia
-
 Singapore
-
 Slovakia
-
 Slovenia
-
 Somalia
-
 South Africa
-
 Spain
-
 Sri Lanka
-
 Sweden
-
 Switzerland
-
 Syria
-
 Taiwan
-
 Tajikistan
-
 Tanzania
-
 Thailand
-
 Trinidad and Tobago
-
 Tunisia
-
 Turkey
-
 UAE
-
 Uganda
-
 Ukraine
-
 United Kingdom
-
United States
-
 Uruguay
-
 Uzbekistan
-
 Venezuela
-
 Vietnam
-
 Yemen
-
 Zambia
-
 Zimbabwe
- Forex
- Crypto












