

SLM slides over 3% as negative momentum and weak earnings outlook weigh on shares

SLM Corporation (SLM) fell 3.24% after reporting a third quarter net loss and lowering its 2026 earnings guidance, with increased credit costs unsettling investors. The down move is supported by sustained selling pressure, with SLM trading below its 20-, 50-, and 200-day moving averages, and momentum signals remaining firmly negative.
 17.41
19.13
Highlights
- SLM Corporation posted a third quarter 2026 net loss of $32.26 million and reduced full-year EPS guidance to $1.95 to $2.05.
- The company maintained its $0.13 quarterly dividend and continued share buybacks, despite raising net charge-off guidance and initiating a shareholder investigation.
- Shares of SLM traded at $18.99 after a 3.24% drop, with multiple oversold signals and a forecast range of $17.05 to $20.93 over the next five days.
Earnings miss and shareholder probe drive negative sentiment shift
SLM Corporation reported a third quarter 2026 net loss of $32.26 million. Full-year net charge-off guidance was raised and 2026 diluted EPS guidance was reduced to a range of $1.95 to $2.05. SLM also announced continued capital returns to shareholders through stock buybacks and a maintained $0.13 quarterly dividend. A shareholder investigation was initiated following a $0.36-per-share swing related to the third-quarter earnings report.
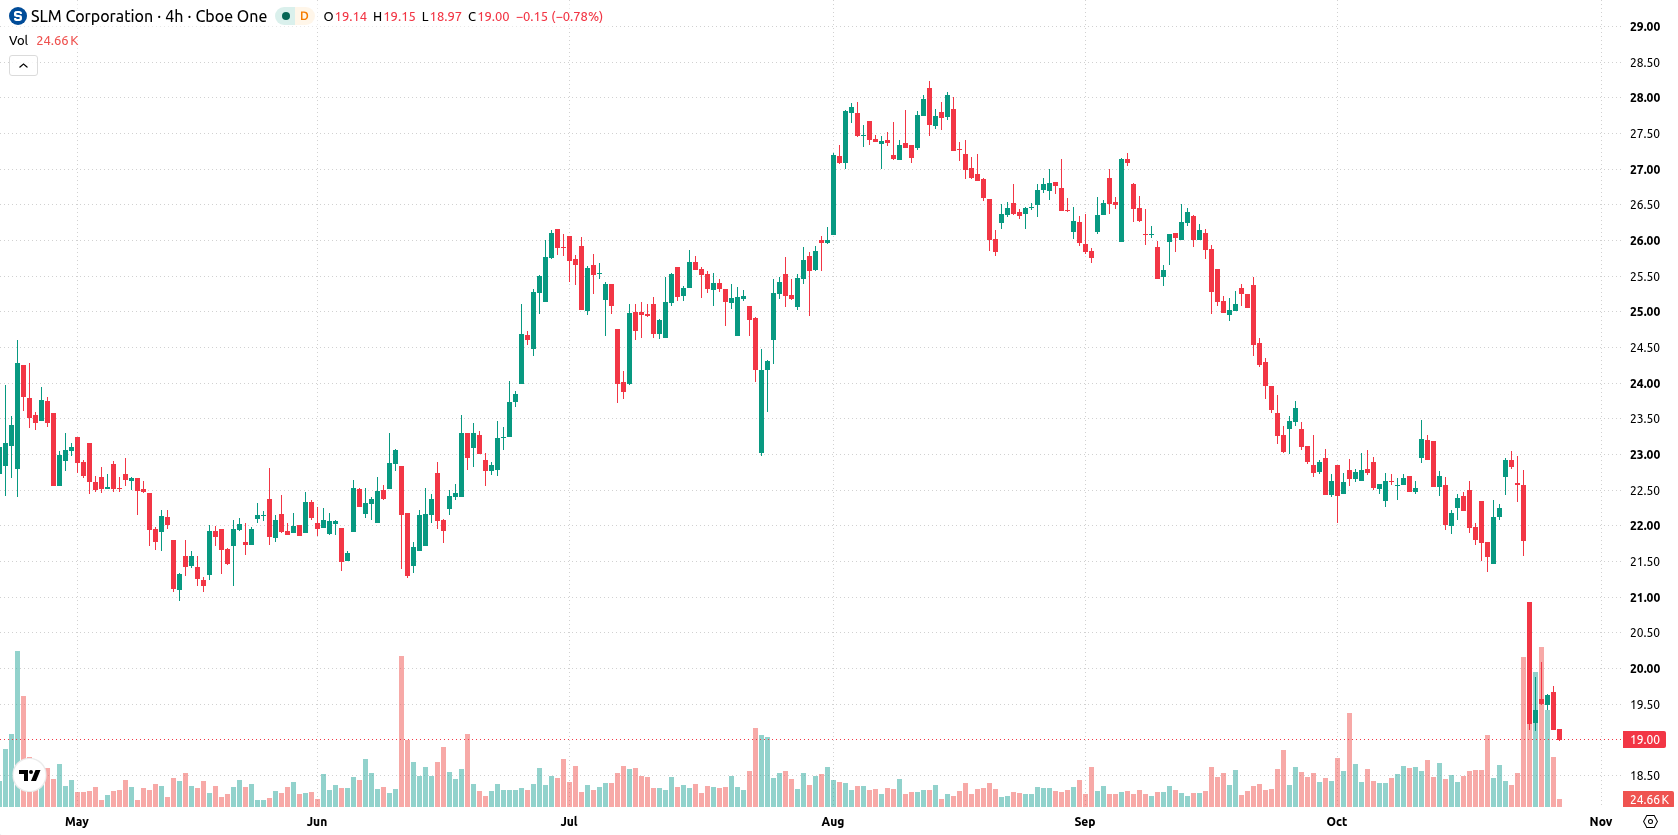
Persistent bearish momentum as major averages and oscillators break down
SLM is trading below its 20-, 50-, and 200-day moving averages (at $22.16, $24.31, and $23.72, respectively), signalling strong pressure from sellers across all timeframes. The longer-term setup remains technically bullish, but near-term momentum is weak, with the nearest resistance at $19.15 and key support at $17.05. Momentum readings are firmly negative: the Moving Average Convergence Divergence (MACD) and Average Directional Index (ADX) both forecast continued selling, while the Relative Strength Index (RSI) is deeply oversold at 26.54. The Stochastic RSI, Commodity Channel Index (CCI), and Bull/Bear Power (BBP) all indicate an oversold condition, with BBP confirming that sellers dominate intraday action. The Awesome Oscillator (AO) further corroborates ongoing bearish pressure. The stock last traded at $18.99, dropping $0.635 or 3.24% on the day after opening with an upside gap of about 0.87%. The price is currently near the session low, and intraday volatility stands at 3.29%, reflecting strong pressure after the open in line with broader bearish momentum signals.
In a recent review, Fitch affirmed investment-grade ratings for SLR Investment Corporation, emphasizing the importance of funding mix and portfolio quality amid sector-wide credit and leverage pressures. The current technical setup in SLM signals a sideways trading range between $17.05 and $20.93, with downside risk prevailing if the stock sustains a move below key support.









-
 Afghanistan
-
 Albania
-
 Algeria
-
 Angola
-
 Argentina
-
 Armenia
-
 Australia
-
 Austria
-
 Azerbaijan
-
 Bahamas
-
 Bahrain
-
 Bangladesh
-
 Belarus
-
 Belgium
-
 Bolivia
-
 Botswana
-
 Brazil
-
 Brunei
-
 Bulgaria
-
 Cambodia
-
 Cameroon
-
 Canada
-
 Chile
-
 China
-
 Colombia
-
 Congo
-
 Costa Rica
-
 Cote d'Ivoire
-
 Croatia
-
 Cuba
-
 Cyprus
-
 Czechia
-
 DR Congo
-
 Denmark
-
 Dominican Republic
-
 Ecuador
-
 Egypt
-
 El Salvador
-
 Estonia
-
 Eswatini
-
 Ethiopia
-
 Finland
-
 France
-
 Georgia
-
 Germany
-
 Ghana
-
 Greece
-
 Haiti
-
 Hong Kong
-
 Hungary
-
 India
-
 Indonesia
-
 Iran, Islamic republic
-
 Iraq
-
 Ireland
-
 Israel
-
 Italy
-
 Jamaica
-
 Japan
-
 Jordan
-
 Kazakhstan
-
 Kenya
-
 Korea
-
 Kuwait
-
 Kyrgyzstan
-
 Laos
-
 Latvia
-
 Lebanon
-
 Lesotho
-
 Libya
-
 Lithuania
-
 Luxembourg
-
 Madagascar
-
 Malaysia
-
 Malta
-
 Mauritius
-
 Mexico
-
 Moldova
-
 Mongolia
-
 Montenegro
-
 Morocco
-
 Mozambique
-
 Myanmar
-
 Namibia
-
 Nepal
-
 Netherlands
-
 New Zealand
-
 Nigeria
-
 North Macedonia
-
 Norway
-
 Oman
-
 Pakistan
-
 Palestine
-
 Panama
-
 Papua New Guinea
-
 Paraguay
-
 Peru
-
 Philippines
-
 Poland
-
 Portugal
-
 Puerto Rico
-
 Qatar
-
 Reunion
-
 Romania
-
 Rwanda
-
 Saudi Arabia
-
 Serbia
-
 Singapore
-
 Slovakia
-
 Slovenia
-
 Somalia
-
 South Africa
-
 Spain
-
 Sri Lanka
-
 Sweden
-
 Switzerland
-
 Syria
-
 Taiwan
-
 Tajikistan
-
 Tanzania
-
 Thailand
-
 Trinidad and Tobago
-
 Tunisia
-
 Turkey
-
 UAE
-
 Uganda
-
 Ukraine
-
 United Kingdom
-
United States
-
 Uruguay
-
 Uzbekistan
-
 Venezuela
-
 Vietnam
-
 Yemen
-
 Zambia
-
 Zimbabwe
- Forex
- Crypto












