

What's behind BlackRock's latest 4.5% stock pullback?

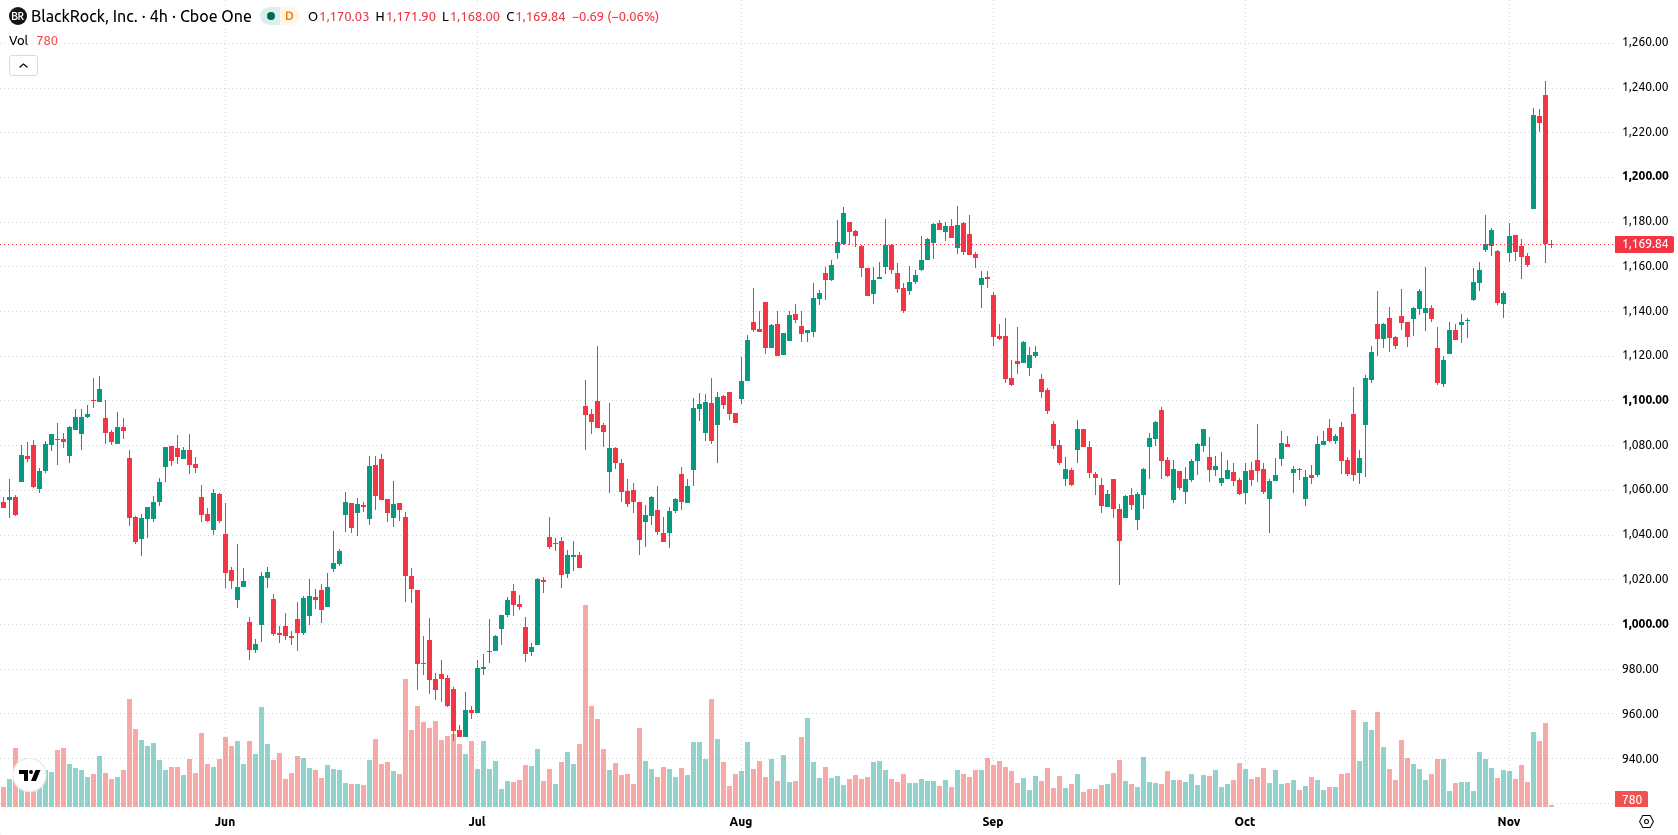
BlackRock, Inc. (BLK) fell 4.45% after opening higher, even as its strong quarterly earnings and new product launches provided a positive backdrop. The weak session is reinforced by near-term selling pressure and the stock's approach to key intraday support, which limits the downside against an otherwise bullish technical structure.
 1193.87
1239.46
Highlights
- BlackRock reported third-quarter revenue of $7.75 billion and diluted earnings per share of $10.57.
- Institutional investors including AIA Group Ltd and Provenance Wealth Advisors significantly increased or initiated stakes in BlackRock during the third quarter.
- BlackRock stock remains in a bullish technical trend with strong momentum, an expected range of $1,123 to $1,216, and indicators warning of overbought conditions that could lead to short-term downside.
Position building by institutions and new ETF launch under sell pressure
BlackRock reported third-quarter 2026 revenue growth to $7.75 billion and an increase in diluted earnings per share to $10.57. Investment advisory and administration fees were $5.783 billion during the same period. Institutional investors, including AIA Group Ltd, Provenance Wealth Advisors LLC, and Associated Banc Corp, added or initiated sizeable positions in BlackRock in the third quarter. The company also launched an actively managed iShares ETF focused on robotics and related technologies, though price action has remained under broader selling pressure.
Bullish structure meets correction risk on overbought signals
BlackRock is trading above its 20-day, 50-day, and 200-day moving averages, with the current price at $1,169 versus the MA-20 at $1,129, MA-50 at $1,104, and MA-200 at $1,064. This setup confirms a bullish structure across all observed timeframes, with immediate support at $1,161 and resistance at $1,216. Momentum indicators remain strong, as the MACD and Average Directional Index (ADX) both signal buy conditions, and the Awesome Oscillator confirms continued upward pressure. However, the Relative Strength Index (RSI), Stochastic RSI, and Commodity Channel Index (CCI) all register in the overbought zone, raising the risk of a downside correction. Bull/Bear Power (BBP) is well above zero, showing buyers dominate intraday momentum. The price is near the session's low, and volatility has risen to 6.69%, with selling pressure setting the tone after the initial upside gap. This highlights a divergence between overbought oscillators and the broader bullish momentum.
Previously it was reported that BlackRock entered into an exploratory agreement with SBI Holdings and Startale to connect tokenized money market funds with a yen-denominated stablecoin, aiming to facilitate links between traditional finance and blockchain-based assets. The current technical outlook complements BlackRock’s ongoing innovation initiatives, with active price levels suggesting that traders should monitor the $1,123 support and $1,216 resistance as potential break points for directional moves in the coming sessions.






Latest BlackRock News





-
 Afghanistan
-
 Albania
-
 Algeria
-
 Angola
-
 Argentina
-
 Armenia
-
 Australia
-
 Austria
-
 Azerbaijan
-
 Bahamas
-
 Bahrain
-
 Bangladesh
-
 Belarus
-
 Belgium
-
 Bolivia
-
 Botswana
-
 Brazil
-
 Brunei
-
 Bulgaria
-
 Cambodia
-
 Cameroon
-
 Canada
-
 Chile
-
 China
-
 Colombia
-
 Congo
-
 Costa Rica
-
 Cote d'Ivoire
-
 Croatia
-
 Cuba
-
 Cyprus
-
 Czechia
-
 DR Congo
-
 Denmark
-
 Dominican Republic
-
 Ecuador
-
 Egypt
-
 El Salvador
-
 Estonia
-
 Eswatini
-
 Ethiopia
-
 Finland
-
 France
-
 Georgia
-
 Germany
-
 Ghana
-
 Greece
-
 Haiti
-
 Hong Kong
-
 Hungary
-
 India
-
 Indonesia
-
 Iran, Islamic republic
-
 Iraq
-
 Ireland
-
 Israel
-
 Italy
-
 Jamaica
-
 Japan
-
 Jordan
-
 Kazakhstan
-
 Kenya
-
 Korea
-
 Kuwait
-
 Kyrgyzstan
-
 Laos
-
 Latvia
-
 Lebanon
-
 Lesotho
-
 Libya
-
 Lithuania
-
 Luxembourg
-
 Madagascar
-
 Malaysia
-
 Malta
-
 Mauritius
-
 Mexico
-
 Moldova
-
 Mongolia
-
 Montenegro
-
 Morocco
-
 Mozambique
-
 Myanmar
-
 Namibia
-
 Nepal
-
 Netherlands
-
 New Zealand
-
 Nigeria
-
 North Macedonia
-
 Norway
-
 Oman
-
 Pakistan
-
 Palestine
-
 Panama
-
 Papua New Guinea
-
 Paraguay
-
 Peru
-
 Philippines
-
 Poland
-
 Portugal
-
 Puerto Rico
-
 Qatar
-
 Reunion
-
 Romania
-
 Rwanda
-
 Saudi Arabia
-
 Serbia
-
 Singapore
-
 Slovakia
-
 Slovenia
-
 Somalia
-
 South Africa
-
 Spain
-
 Sri Lanka
-
 Sweden
-
 Switzerland
-
 Syria
-
 Taiwan
-
 Tajikistan
-
 Tanzania
-
 Thailand
-
 Trinidad and Tobago
-
 Tunisia
-
 Turkey
-
 UAE
-
 Uganda
-
 Ukraine
-
 United Kingdom
-
United States
-
 Uruguay
-
 Uzbekistan
-
 Venezuela
-
 Vietnam
-
 Yemen
-
 Zambia
-
 Zimbabwe
- Forex
- Crypto












