

What's behind Paycom's latest 3.2% stock pullback?

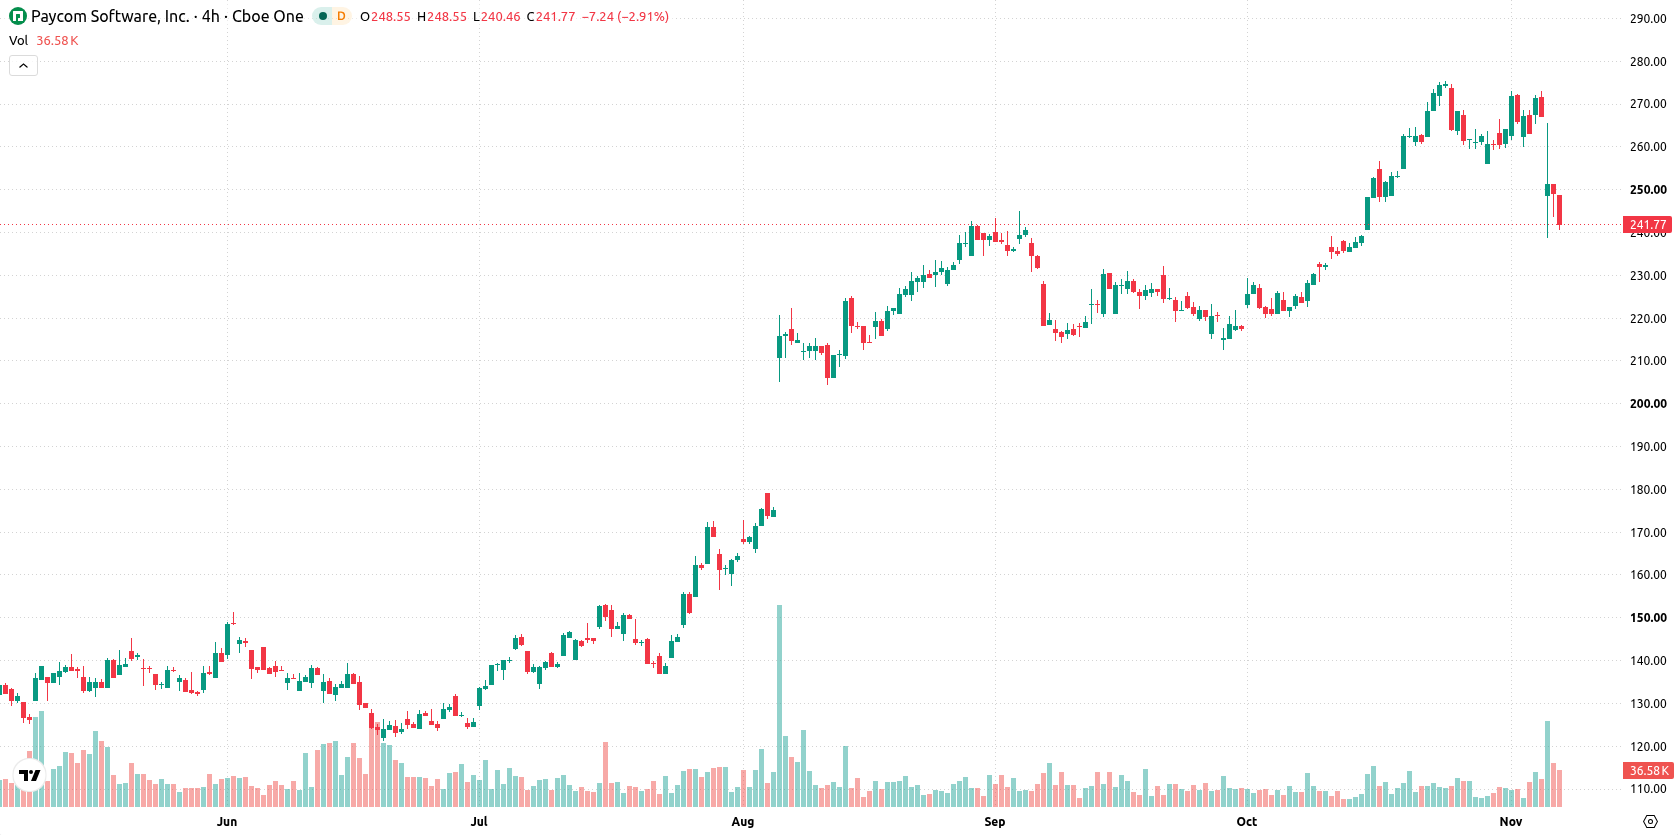
Paycom Software, Inc. (PAYC) dropped 3.16% after opening with a downside gap, even as the company posted strong third-quarter earnings, raised 2026 guidance, and declared its 15th consecutive quarterly cash dividend. The move reflects continued short-term selling pressure, with price now trading below the 20-day moving average and testing key near-term support.
 245.69
272.98
Highlights
- Paycom reported third-quarter 2026 revenue of $544 million, up 10% year-over-year and ahead of analyst forecasts.
- The company raised its 2026 full-year revenue and adjusted EBITDA projections again, declared its 15th consecutive quarterly cash dividend, and cut shares outstanding by nearly 20%.
- Paycom stock trades below its 20-day moving average with short-term selling pressure, and is expected to fluctuate in a $222.1 to $262.16 range over the next five days.
Revenue, guidance, and AI adoption boost overshadowed by persistent selling
Paycom reported third-quarter 2026 revenue of $544 million, marking approximately 10% year-over-year growth and exceeding analyst expectations. The company raised its full-year 2026 revenue and adjusted EBITDA guidance for the second time this year. Paycom also declared its 15th consecutive quarterly cash dividend, continuing the dividend policy introduced in 2023, and paid $16.7 million in cash dividends during the third quarter. The company continued a share repurchase program that reduced shares outstanding by nearly 20% year-over-year and registered increased adoption of its AI solutions, though price action remained under broader selling pressure.
Mixed momentum signals offset bullish trend amid downside gap
Paycom is trading below its 20-day moving average at $256.74 but remains above the 50-day ($238.36) and 200-day ($166.12) moving averages, indicating short-term selling within an otherwise bullish medium- and long-term trend. The 20-day moving average at $256.74 represents the nearest resistance, while immediate support lies at the 50-day moving average of $238.36. Momentum signals are mixed: the MACD points to strong buying potential, the ADX signals a sell, the RSI and CCI are neutral, and Stochastic RSI is in an oversold zone, pointing to rebound potential. Bull/Bear Power stays positive, showing intraday buyers remain active. The session opened with a downside gap of about $6.59 or 2.64%, and volatility remains moderate at 1.50% with PAYC trading near session lows after a 3.16% drop, suggesting persistent pressure even as momentum indicators highlight a stand-off between buyers and sellers.
Earlier, analysts noted that Paycom was in a firm bullish trend but highlighted the potential for sharp price moves around key resistance levels. The recent downside gap and break below the 20-day moving average now place a spotlight on the $222.10 support level as the key area for traders to monitor in the coming sessions.










-
 Afghanistan
-
 Albania
-
 Algeria
-
 Angola
-
 Argentina
-
 Armenia
-
 Australia
-
 Austria
-
 Azerbaijan
-
 Bahamas
-
 Bahrain
-
 Bangladesh
-
 Belarus
-
 Belgium
-
 Bolivia
-
 Botswana
-
 Brazil
-
 Brunei
-
 Bulgaria
-
 Cambodia
-
 Cameroon
-
 Canada
-
 Chile
-
 China
-
 Colombia
-
 Congo
-
 Costa Rica
-
 Cote d'Ivoire
-
 Croatia
-
 Cuba
-
 Cyprus
-
 Czechia
-
 DR Congo
-
 Denmark
-
 Dominican Republic
-
 Ecuador
-
 Egypt
-
 El Salvador
-
 Estonia
-
 Eswatini
-
 Ethiopia
-
 Finland
-
 France
-
 Georgia
-
 Germany
-
 Ghana
-
 Greece
-
 Haiti
-
 Hong Kong
-
 Hungary
-
 India
-
 Indonesia
-
 Iran, Islamic republic
-
 Iraq
-
 Ireland
-
 Israel
-
 Italy
-
 Jamaica
-
 Japan
-
 Jordan
-
 Kazakhstan
-
 Kenya
-
 Korea
-
 Kuwait
-
 Kyrgyzstan
-
 Laos
-
 Latvia
-
 Lebanon
-
 Lesotho
-
 Libya
-
 Lithuania
-
 Luxembourg
-
 Madagascar
-
 Malaysia
-
 Malta
-
 Mauritius
-
 Mexico
-
 Moldova
-
 Mongolia
-
 Montenegro
-
 Morocco
-
 Mozambique
-
 Myanmar
-
 Namibia
-
 Nepal
-
 Netherlands
-
 New Zealand
-
 Nigeria
-
 North Macedonia
-
 Norway
-
 Oman
-
 Pakistan
-
 Palestine
-
 Panama
-
 Papua New Guinea
-
 Paraguay
-
 Peru
-
 Philippines
-
 Poland
-
 Portugal
-
 Puerto Rico
-
 Qatar
-
 Reunion
-
 Romania
-
 Rwanda
-
 Saudi Arabia
-
 Serbia
-
 Singapore
-
 Slovakia
-
 Slovenia
-
 Somalia
-
 South Africa
-
 Spain
-
 Sri Lanka
-
 Sweden
-
 Switzerland
-
 Syria
-
 Taiwan
-
 Tajikistan
-
 Tanzania
-
 Thailand
-
 Trinidad and Tobago
-
 Tunisia
-
 Turkey
-
 UAE
-
 Uganda
-
 Ukraine
-
 United Kingdom
-
United States
-
 Uruguay
-
 Uzbekistan
-
 Venezuela
-
 Vietnam
-
 Yemen
-
 Zambia
-
 Zimbabwe
- Forex
- Crypto












