

Will S&P 500 index extend gains as momentum signals remain mixed?

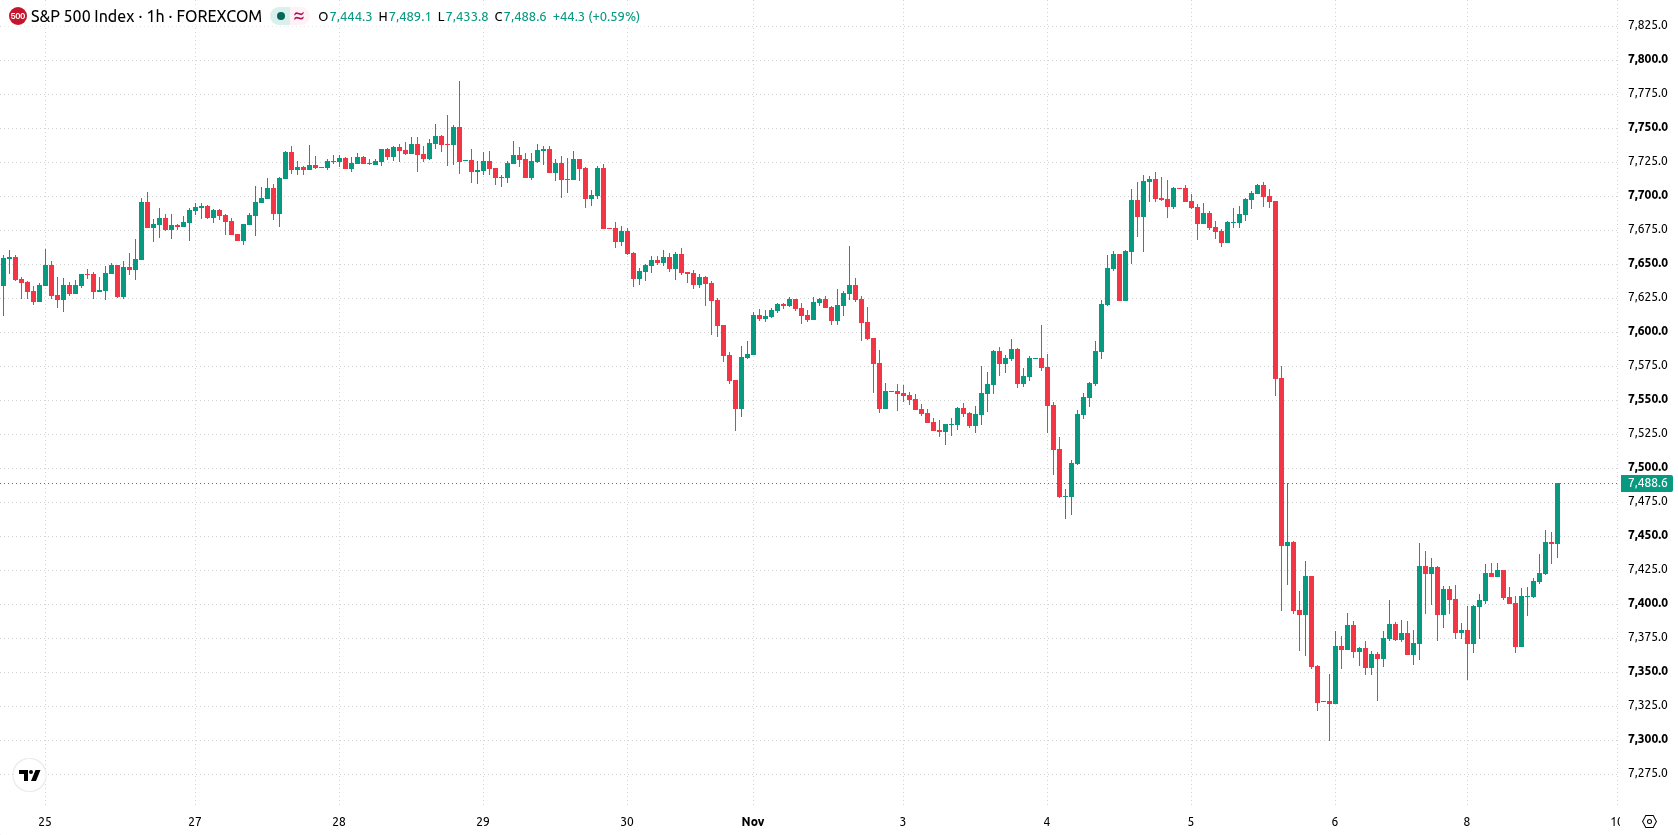
S&P 500 (SPX) is trading at 7,479.77, climbing 1.37% for the day. The index is positioned above its key short-term average but below the intermediate moving average, while maintaining support above the long-term trend indicator.
 7441.01
7714.32
Highlights
- The S&P 500 posted its steepest single-session drop since April 2025, erasing about 3 trillion in market value on Thursday.
- Friday saw the index recover 0.3 percent, as attention moves to fundamental reassessment and remaining Q3 2026 earnings announcements.
- Technical analysis projects SPX to consolidate between 7,341 and 7,560 points, with indicators showing high downside probability and weak momentum support for a rebound.
Leveraged unwinding and chip losses trigger risk-off as earnings fade
On Thursday, the S&P 500 experienced its sharpest single-session decline since April 2025, erasing approximately $3 trillion in market value amid pronounced losses in chip stocks and causing a sweeping unwinding of leveraged positions. This wave of forced selling heightened volatility and prompted short-term risk aversion, but the index managed to rebound 0.3% on Friday, reflecting modest dip-buying interest, according to Benzinga. Meanwhile, with most S&P 500 constituents having already reported their Q3 2026 results, as compiled by FXStreet, the market's focus has shifted toward fundamental reassessment and remaining earnings disclosures.
Divergent signals as sell momentum clashes with neutral indicators
On the technical front, SPX is currently trading above the MA-20 but below the MA-50 on the hourly chart, while maintaining support over the MA-200. The Ichimoku Kijun level at 7,532 stands as immediate resistance. Momentum signals are mixed: both MACD and ADX point to a sell bias, yet RSI, Stochastic RSI, and CCI remain neutral, indicating a lack of short-term extremes. Bull/Bear Power is negative, suggesting seller dominance in intraday flows, and the Awesome Oscillator shows no clear trend alignment, reinforcing the divergence between price action and momentum.
Consolidation favored amid high downside risk and range-bound dynamics
In the short term, SPX is expected to trade within a 7,341–7,560 volatility band relative to current levels over the next 2–3 trading days. The probability of an upward breakout appears very low, while odds for a downward move are elevated. The baseline scenario calls for consolidation inside this corridor. Should SPX rise above 7,532, a move toward the upper end of the range or higher could follow, whereas a breach below 7,341 would confirm renewed downside momentum.
Earlier, analysts noted that technology's significant weighting in the S&P 500 continues to amplify the impact of swings in AI and chip-related shares on the broader index. The current setup reinforces those concerns, with technical signals now pointing to heightened short-term downside risk and a likely consolidation phase, making the 7,341 support level a critical threshold to monitor for renewed volatility.











-
 Afghanistan
-
 Albania
-
 Algeria
-
 Angola
-
 Argentina
-
 Armenia
-
 Australia
-
 Austria
-
 Azerbaijan
-
 Bahamas
-
 Bahrain
-
 Bangladesh
-
 Belarus
-
 Belgium
-
 Bolivia
-
 Botswana
-
 Brazil
-
 Brunei
-
 Bulgaria
-
 Cambodia
-
 Cameroon
-
 Canada
-
 Chile
-
 China
-
 Colombia
-
 Congo
-
 Costa Rica
-
 Cote d'Ivoire
-
 Croatia
-
 Cuba
-
 Cyprus
-
 Czechia
-
 DR Congo
-
 Denmark
-
 Dominican Republic
-
 Ecuador
-
 Egypt
-
 El Salvador
-
 Estonia
-
 Eswatini
-
 Ethiopia
-
 Finland
-
 France
-
 Georgia
-
 Germany
-
 Ghana
-
 Greece
-
 Haiti
-
 Hong Kong
-
 Hungary
-
 India
-
 Indonesia
-
 Iran, Islamic republic
-
 Iraq
-
 Ireland
-
 Israel
-
 Italy
-
 Jamaica
-
 Japan
-
 Jordan
-
 Kazakhstan
-
 Kenya
-
 Korea
-
 Kuwait
-
 Kyrgyzstan
-
 Laos
-
 Latvia
-
 Lebanon
-
 Lesotho
-
 Libya
-
 Lithuania
-
 Luxembourg
-
 Madagascar
-
 Malaysia
-
 Malta
-
 Mauritius
-
 Mexico
-
 Moldova
-
 Mongolia
-
 Montenegro
-
 Morocco
-
 Mozambique
-
 Myanmar
-
 Namibia
-
 Nepal
-
 Netherlands
-
 New Zealand
-
 Nigeria
-
 North Macedonia
-
 Norway
-
 Oman
-
 Pakistan
-
 Palestine
-
 Panama
-
 Papua New Guinea
-
 Paraguay
-
 Peru
-
 Philippines
-
 Poland
-
 Portugal
-
 Puerto Rico
-
 Qatar
-
 Reunion
-
 Romania
-
 Rwanda
-
 Saudi Arabia
-
 Serbia
-
 Singapore
-
 Slovakia
-
 Slovenia
-
 Somalia
-
 South Africa
-
 Spain
-
 Sri Lanka
-
 Sweden
-
 Switzerland
-
 Syria
-
 Taiwan
-
 Tajikistan
-
 Tanzania
-
 Thailand
-
 Trinidad and Tobago
-
 Tunisia
-
 Turkey
-
 UAE
-
 Uganda
-
 Ukraine
-
 United Kingdom
-
United States
-
 Uruguay
-
 Uzbekistan
-
 Venezuela
-
 Vietnam
-
 Yemen
-
 Zambia
-
 Zimbabwe
- Forex
- Crypto












