


CleanSpark, Inc. (CLSK) surged 9.84% on renewed buying interest, even as the latest news cycle remains quiet regarding corporate events. The move looks limited, with persistent technical headwinds as the stock remains below all major moving averages.
 6.91
7.50
Highlights
- Shares of CleanSpark trade below all major moving averages, confirming a persistent bearish trend across all timeframes.
- Negative momentum is confirmed by key technical indicators, with sell signals from MACD, ADX, and Awesome Oscillator, though some signs of selling exhaustion appear.
- Over the next five days, the stock is projected to move between $5.45 and $8.07, with 75% probability for further downside unless it closes above $6.88.
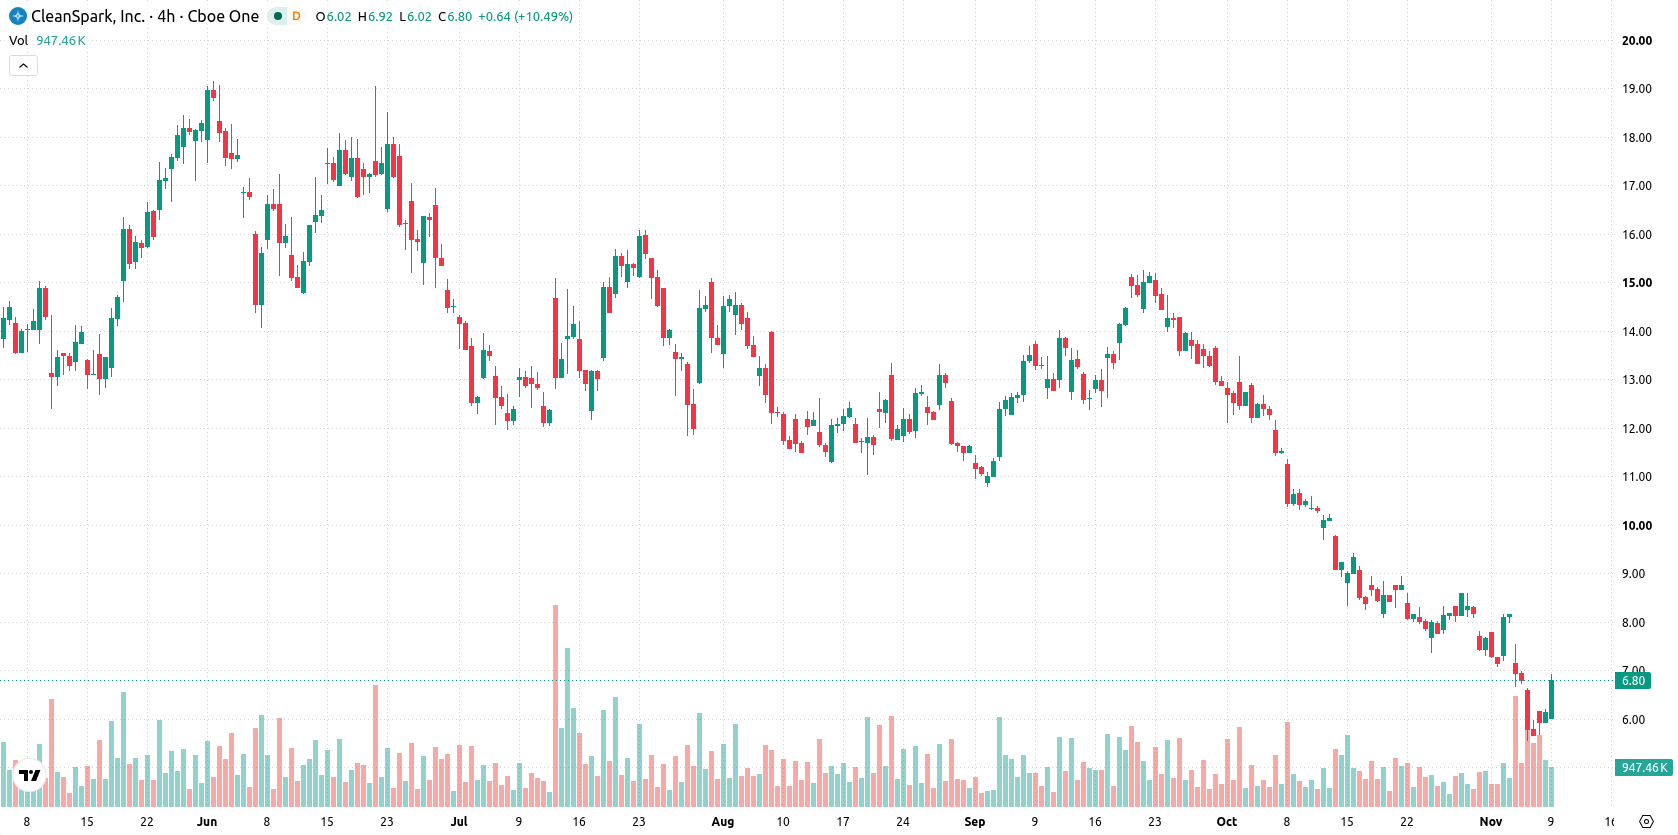
Persistent selling at major averages with mixed momentum signals
CleanSpark is trading below its 20-day, 50-day, and 200-day moving averages ($8.17, $10.98, and $12.19), highlighting persistent selling pressure across all timeframes. The immediate trading range is defined by resistance at $6.88 (today's high) and support at $6.07 (today's low), with a bearish long-term trend confirmed by the 50-day versus 200-day alignment. Momentum indicators present a mixed technical picture. The MACD and Average Directional Index (ADX) are signaling a sell, confirming negative momentum. The Relative Strength Index (RSI) reads neutral, Stochastic RSI is also neutral, and the Commodity Channel Index (CCI) is in the oversold zone, pointing to potential selling exhaustion. Bull/Bear Power (BBP) is negative, indicating that sellers currently dominate intraday flow. The Awesome Oscillator is negative, reinforcing the direction of the prevailing trend. CleanSpark climbed $0.605 from the previous close, a rise of 9.84% with an initial downside gap of about $0.08 (1.3%). The price is trading near the upper end of today's range, and intraday volatility stands at 13.34%. This intraday strength contrasts with soft momentum readings, exposing a divergence between near-term buyers and the broader negative trend.
Previously it was reported that CleanSpark faced persistent technical resistance and a predominantly bearish outlook. The latest analysis strengthens this view, with ongoing negative momentum and sellers dominating short-term flows, making the $6.88 resistance a critical level to watch for any trend reversal in the coming sessions.









-
 Afghanistan
-
 Albania
-
 Algeria
-
 Angola
-
 Argentina
-
 Armenia
-
 Australia
-
 Austria
-
 Azerbaijan
-
 Bahamas
-
 Bahrain
-
 Bangladesh
-
 Belarus
-
 Belgium
-
 Bolivia
-
 Botswana
-
 Brazil
-
 Brunei
-
 Bulgaria
-
 Cambodia
-
 Cameroon
-
 Canada
-
 Chile
-
 China
-
 Colombia
-
 Congo
-
 Costa Rica
-
 Cote d'Ivoire
-
 Croatia
-
 Cuba
-
 Cyprus
-
 Czechia
-
 DR Congo
-
 Denmark
-
 Dominican Republic
-
 Ecuador
-
 Egypt
-
 El Salvador
-
 Estonia
-
 Eswatini
-
 Ethiopia
-
 Finland
-
 France
-
 Georgia
-
 Germany
-
 Ghana
-
 Greece
-
 Haiti
-
 Hong Kong
-
 Hungary
-
 India
-
 Indonesia
-
 Iran, Islamic republic
-
 Iraq
-
 Ireland
-
 Israel
-
 Italy
-
 Jamaica
-
 Japan
-
 Jordan
-
 Kazakhstan
-
 Kenya
-
 Korea
-
 Kuwait
-
 Kyrgyzstan
-
 Laos
-
 Latvia
-
 Lebanon
-
 Lesotho
-
 Libya
-
 Lithuania
-
 Luxembourg
-
 Madagascar
-
 Malaysia
-
 Malta
-
 Mauritius
-
 Mexico
-
 Moldova
-
 Mongolia
-
 Montenegro
-
 Morocco
-
 Mozambique
-
 Myanmar
-
 Namibia
-
 Nepal
-
 Netherlands
-
 New Zealand
-
 Nigeria
-
 North Macedonia
-
 Norway
-
 Oman
-
 Pakistan
-
 Palestine
-
 Panama
-
 Papua New Guinea
-
 Paraguay
-
 Peru
-
 Philippines
-
 Poland
-
 Portugal
-
 Puerto Rico
-
 Qatar
-
 Reunion
-
 Romania
-
 Rwanda
-
 Saudi Arabia
-
 Serbia
-
 Singapore
-
 Slovakia
-
 Slovenia
-
 Somalia
-
 South Africa
-
 Spain
-
 Sri Lanka
-
 Sweden
-
 Switzerland
-
 Syria
-
 Taiwan
-
 Tajikistan
-
 Tanzania
-
 Thailand
-
 Trinidad and Tobago
-
 Tunisia
-
 Turkey
-
 UAE
-
 Uganda
-
 Ukraine
-
 United Kingdom
-
United States
-
 Uruguay
-
 Uzbekistan
-
 Venezuela
-
 Vietnam
-
 Yemen
-
 Zambia
-
 Zimbabwe
- Forex
- Crypto












