OANDA Free Forex Education


Editorial Note: While we adhere to strict Editorial Integrity, this post may contain references to products from our partners. Here's an explanation for How We Make Money. None of the data and information on this webpage constitutes investment advice according to our Disclaimer.
OANDA provides:
Webinars and seminars (analyzing current market trends, building trading strategies, etc).
Guides and educational materials (technical and fundamental analysis modules, risk mitigation tips).
Successful Forex trading starts with the right education and tools. OANDA, around since 1996, offers courses, webinars, and trading tools for all skill levels. Their educational portal helps traders sharpen analysis and risk management without the usual fluff. MetaTrader 4 and fxTrade come with built-in indicators that help break down market trends, making it easier to spot opportunities and avoid costly mistakes.
Free trading courses from OANDA

OANDA provides a wide range of free educational resources designed for traders of all skill levels. These materials help you gain a deeper understanding of the complexities of Forex trading, improve your practical market analysis skills, and make more informed trading decisions.
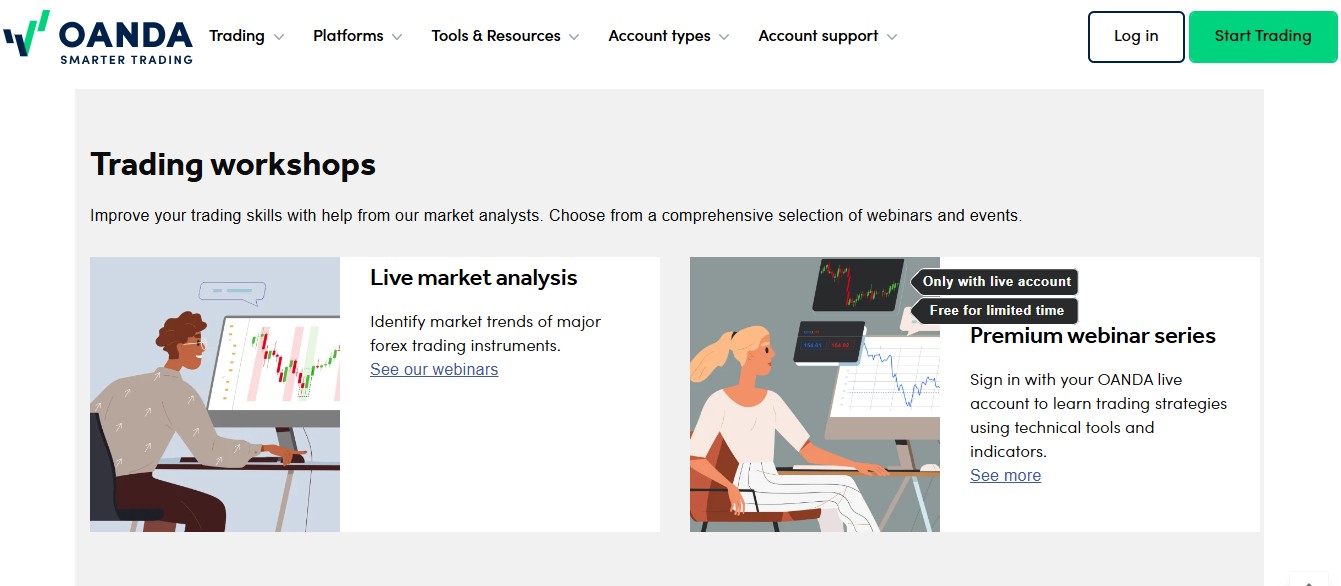
OANDA webinars and seminars
One of the core training formats offered by OANDA are webinars. These events are conducted by professional market analysts with many years of experience. Webinar topics cover a wide range of topics, such as:
Analyzing current market trends using technical indicators.
Fundamental analysis and its application in assessing macroeconomic events.
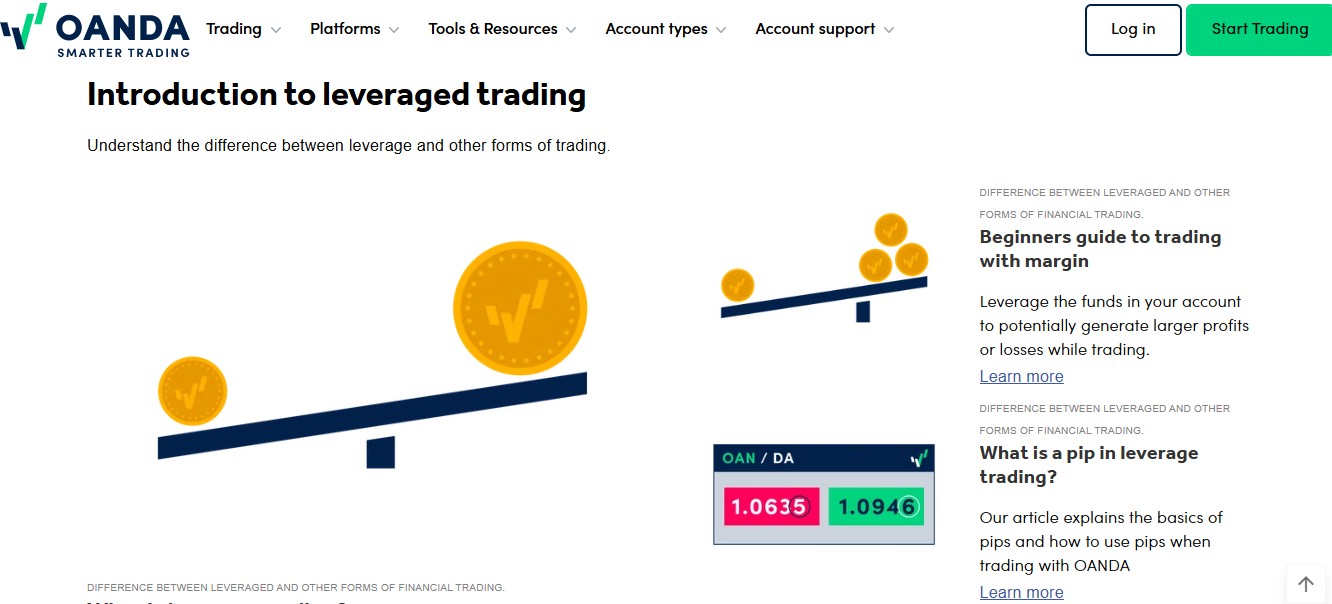
Managing risks when trading with leverage.
Building and testing trading strategies.
Webinar participants gain access to analytical tools that can be applied in real market conditions. Webinars are available to registered users, allowing traders to connect at a time that is convenient for them.
Guides and educational materials
In addition to webinars, OANDA offers a collection of structured educational materials. These materials include:
In-depth technical analysis guides that explain how indicators, oscillators, and chart patterns work.
Fundamental analysis modules that explain how economic news and indicators impact the market.
Money management and risk mitigation tips tailored to traders at different stages of their careers.
Each resource is available through the OANDA Educational Portal and is presented in the form of articles, videos, and step-by-step instructions. This allows traders to study at their own pace.
OANDA’s resources combine theoretical knowledge with practical application. For example, traders can learn how to use OANDA’s built-in market analysis features or work with automated pattern recognition tools. The materials are written in a way that matches real-world trading conditions, making them useful for traders’ daily work.
Trading tools from OANDA
OANDA provides a variety of tools that help traders make more informed decisions in the financial markets. Each tool meets specific needs, including data analysis, risk management, and automation of trading processes. Let's look at the key ones.
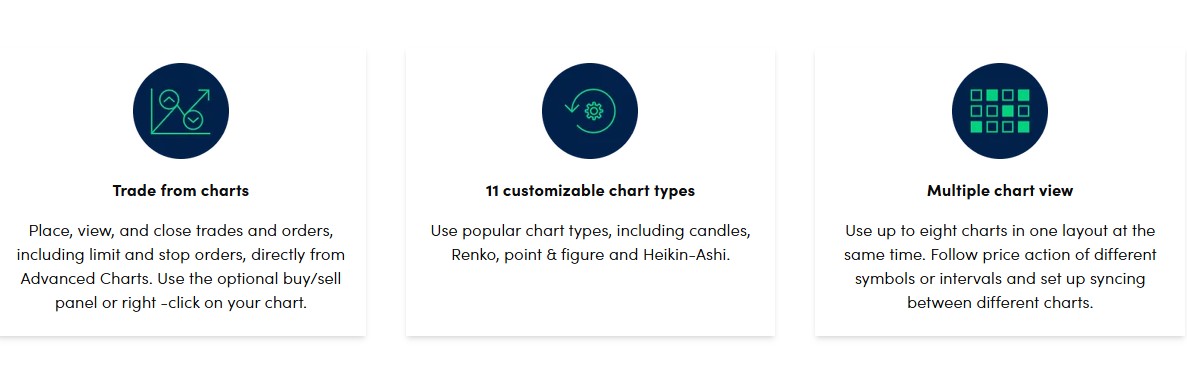
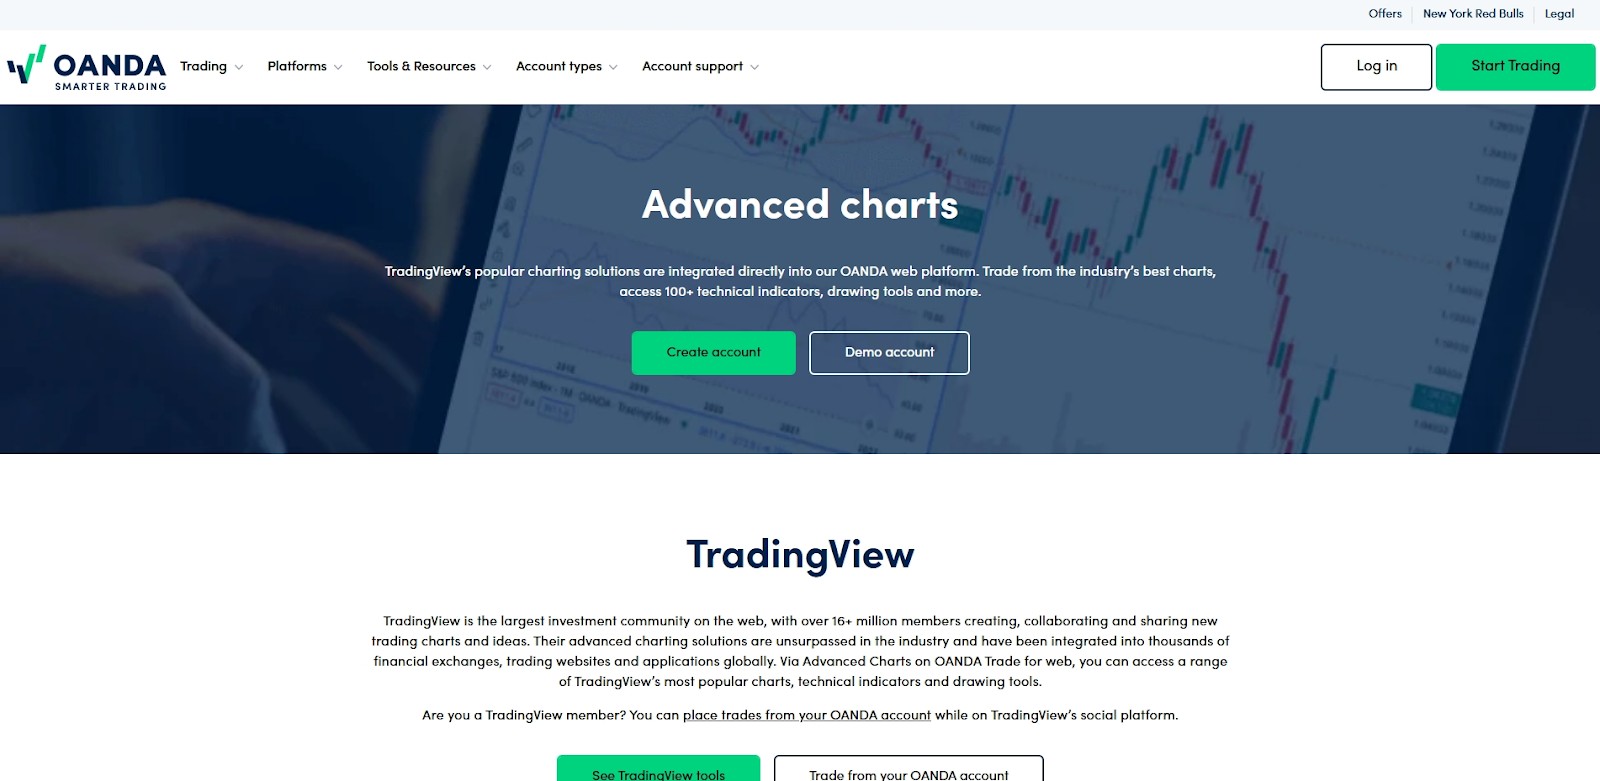
1. Advanced charts
TradingView-powered charts give traders deep market insights. You can use over 65 technical indicators, including moving averages, RSI, and MACD, to refine your strategy. A built-in drawing tool helps highlight support, resistance, and trend lines for better analysis. Custom settings let you adjust timeframes from 5 seconds to a month, making it easy to track price movements. These charts are available on the OANDA Trade platform.
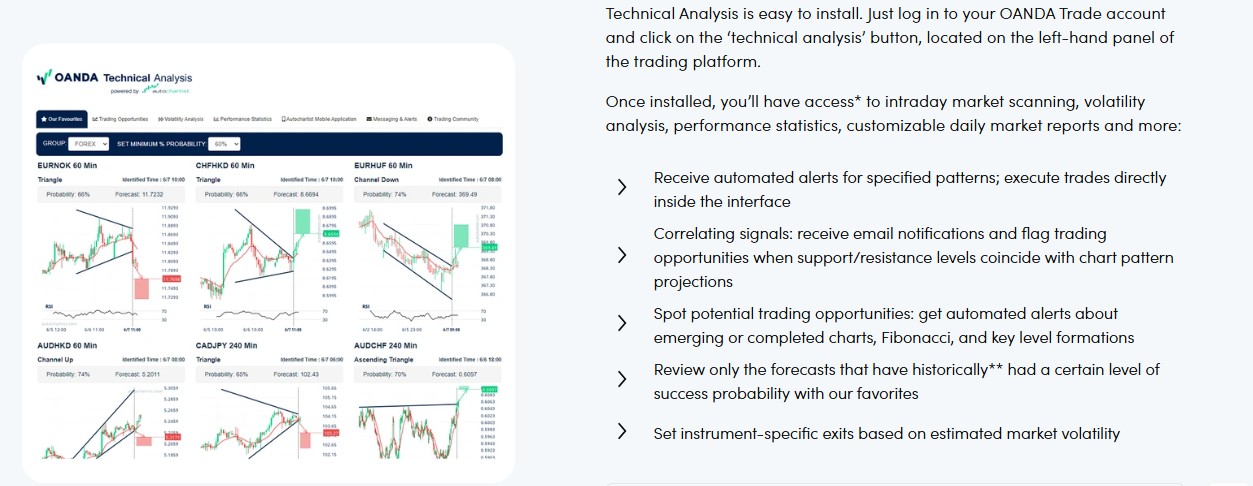
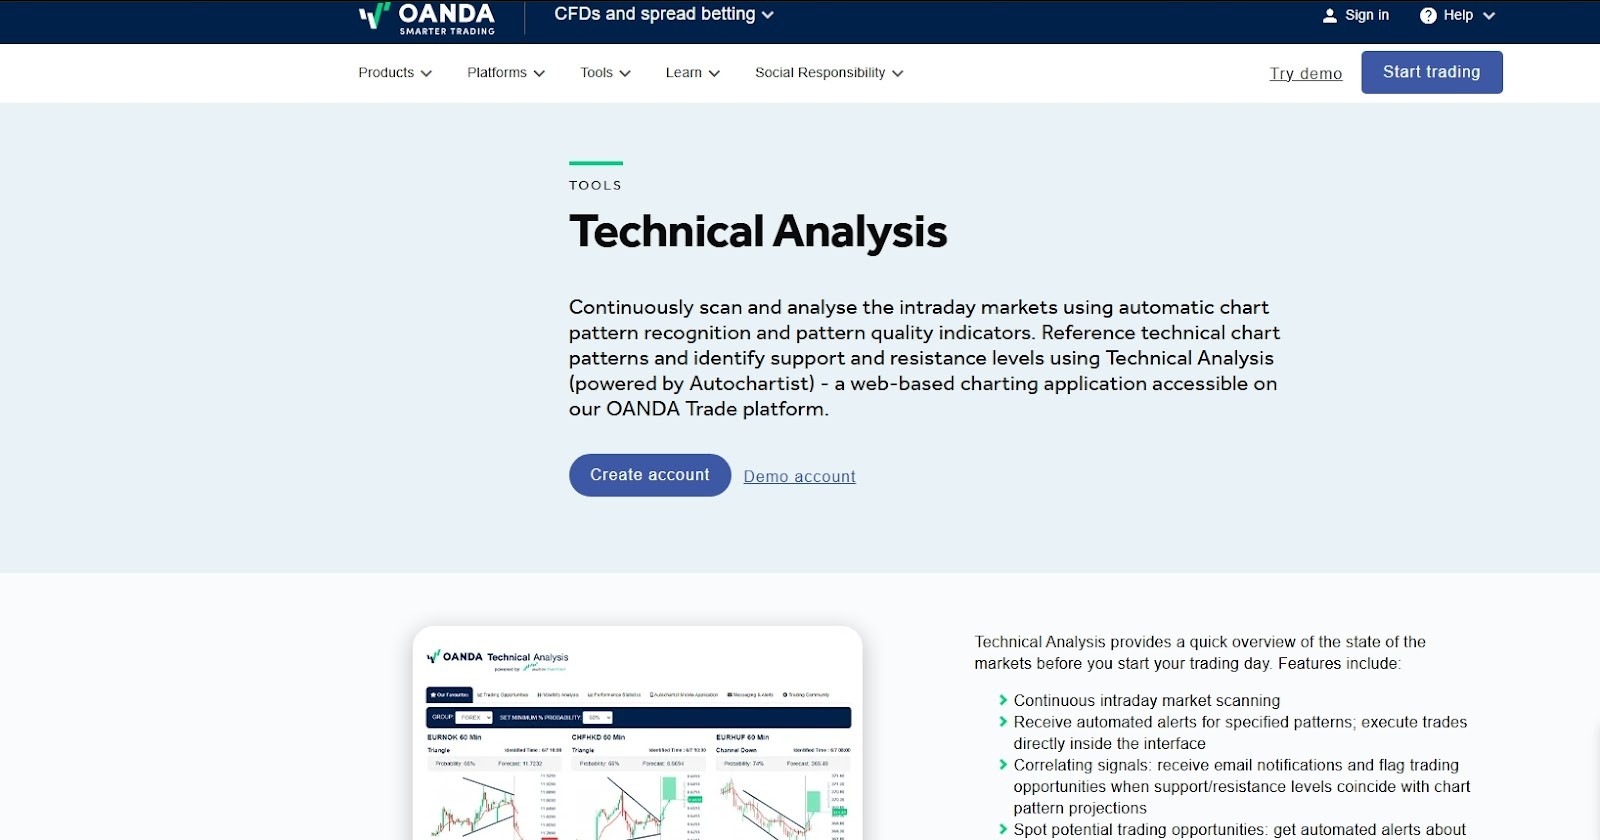
2. Technical analysis
OANDA provides pattern recognition tools that help traders quickly spot key market trends. These features highlight formations like head and shoulders, triangles, and double bottoms, making technical analysis easier. Traders also get insights into the strength of these patterns and their likelihood of playing out. This cuts down the time needed for manual charting and helps improve decision-making. The tools work seamlessly within the OANDA platform and support both short-term and long-term trading strategies.
3. Economic calendar
The OANDA Economic Calendar helps traders track key macroeconomic events such as the release of GDP data, employment reports, and central bank decisions. The calendar displays the exact time of the data release, forecast values, and actual results. Users can filter events by currencies and the degree of their impact on the market. This allows them to take macroeconomic changes into account in a timely manner in their trading strategies. The calendar is available directly through the OANDA Trade platform.
4. API for automated trading
OANDA’s API lets traders build custom trading strategies and automate their workflow. It gives access to real-time market data, order execution, and account management, making it easier to handle trades without manual input. Traders can use it to automate tasks like placing orders, tracking account balances, and adjusting risk settings. The API supports Python and Java, so both beginner and advanced developers can easily integrate it into their systems.
5. Customizable indicators
OANDA traders can access over 65 technical indicators, including customizable settings. Popular tools like Bollinger Bands and Stochastic help fine-tune strategies and identify trading opportunities. The platform’s drawing tools make it easier to spot trends and key price levels. Indicators can be customized to match personal trading styles, allowing for more flexible and precise decision-making.
6. Real-time quotes
OANDA provides real-time data on asset price changes, allowing traders to react instantly to changing market conditions. Quotes cover a wide range of instruments, including currencies, metals, and indices. They are synchronized with global markets, ensuring accurate data and timely delivery. This data is integrated into both the OANDA Trade platform and API.
7. Historical currency data
Traders can access historical currency rate data, allowing for long-term analysis and testing of trading strategies. Historical data spans timeframes from one day to several years and is available for download in convenient formats. This data is useful for analyzing market trends and identifying consistent patterns.
8. Risk management tools
OANDA provides risk calculators to help traders figure out margin size, potential profit, and how much they’re risking per trade. These tools make it easier to set the right trade size and prevent big losses. Whether you're trading manually or using automation, they simplify the process and help you stay in control.
Market analysis from OANDA
OANDA provides its clients with access to Dow Jones FX Select, a service that delivers real-time news, expert trend analysis and in-depth political commentary. Developed by Dow Jones’ global team of journalists and editors, the service is available in multiple languages.
Dow Jones FX select
Dow Jones FX Select provides traders with the following features:
Real news. Instant updates on events impacting financial markets, including economic indicators, political events and corporate news.
Expert trend analysis. In-depth analysis of market trends, based on data and expert opinion, to help traders make informed decisions.
In-depth political commentary. Information on political events and their potential impact on financial markets, provided by experienced analysts.
Integrating Dow Jones FX Select into the OANDA Trade platform allows traders to receive real-time information as they trade, helping them react to changing market conditions in a timely manner.
With Dow Jones FX Select, OANDA clients have access to the quality information they need to effectively analyze the market and make informed trading decisions.
Dow Jones FX Select is one of the key market analysis tools available to OANDA clients, but it is far from the only one the company provides. In addition to Dow Jones FX Select, OANDA offers additional market analysis and monitoring tools, such as:
Market trend identification function
This OANDA tool tracks market price changes and helps traders spot trends early. It uses past data and AI models to find repeating price patterns that hint at future moves. The tool continuously updates with new data, making it useful for both short-term and long-term trading.
Market volume distribution
The tool helps you track trading volumes at different price levels, showing where most trades happen. This can point to strong price levels that might act as support or resistance. Traders use this insight to make smarter entry and exit decisions. Charts on the OANDA Trade platform make this easy to see and analyze in real time.
Correlation analysis tool
Correlation analysis helps traders see how different assets move together. For example, some currency pairs or commodities rise and fall in sync, while others move in opposite directions. Spotting these patterns lets you build a balanced portfolio or hedge against losses. By understanding correlations, traders can make smarter decisions, reduce risk, and fine-tune their strategies.
Market activity signals
This tool tracks not only price changes, but also the speed and volume of trades. Market Activity Signals inform traders of spikes in activity that may indicate the beginning of a trend or market change. The tool is useful for short-term trading and identifying entry points.
Deep analysis of order volumes
OANDA provides traders with access to data on orders placed, including the price levels where stop and limit orders are concentrated. This allows you to predict possible price movements and areas where consolidation may occur. The tool is especially useful for assessing liquidity and building strategies based on expected market behavior.
Integration of data from COT reports
OANDA breaks down the Commitments of Traders (COT) reports from the US Commodity Futures Trading Commission, making it easier to see how big players like hedge funds and institutions are positioned. Traders use this info to spot market trends and plan long-term strategies based on real money movements.
How to start learning and using OANDA tools
To effectively start working with OANDA, we recommend using the educational resources and trading tools available on the platform. To register for OANDA webinars and access charts and technical analysis tools, follow this algorithm:
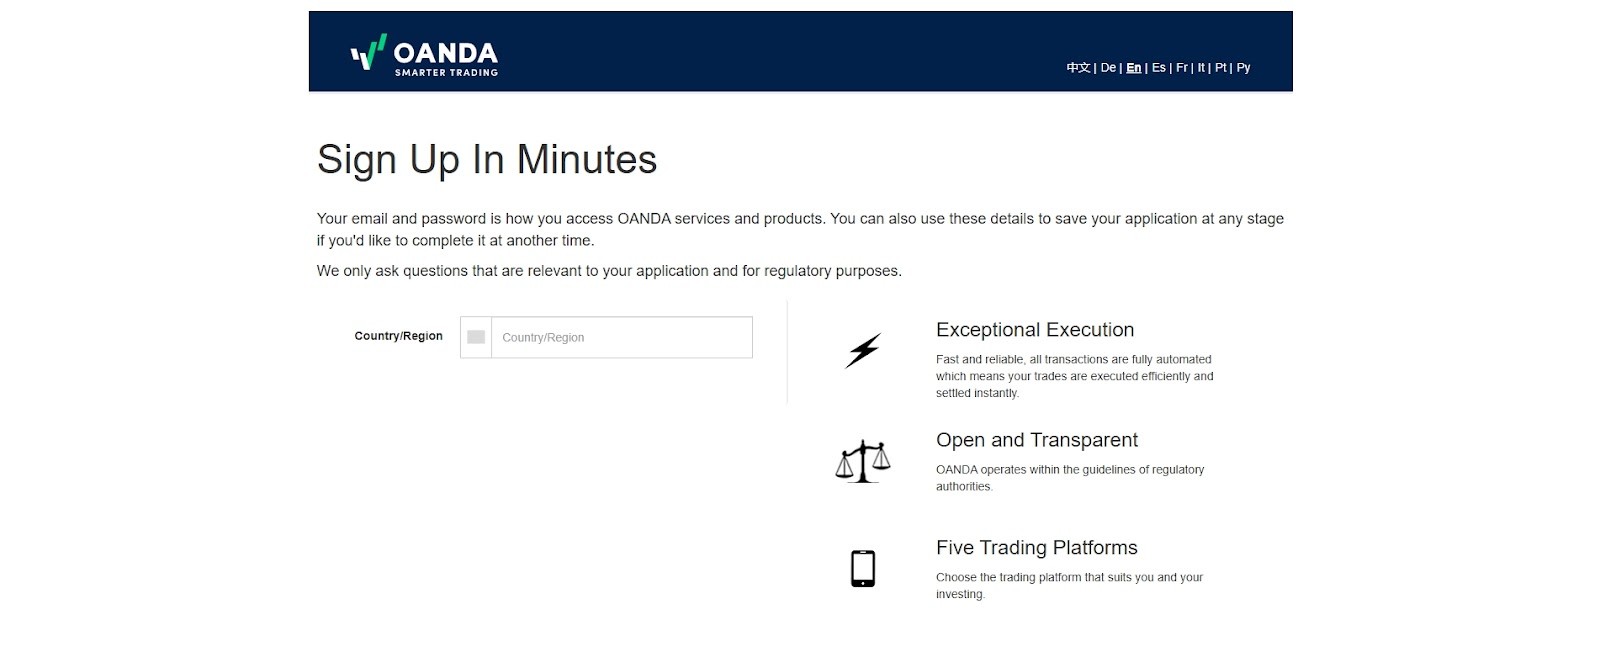
Register for webinars
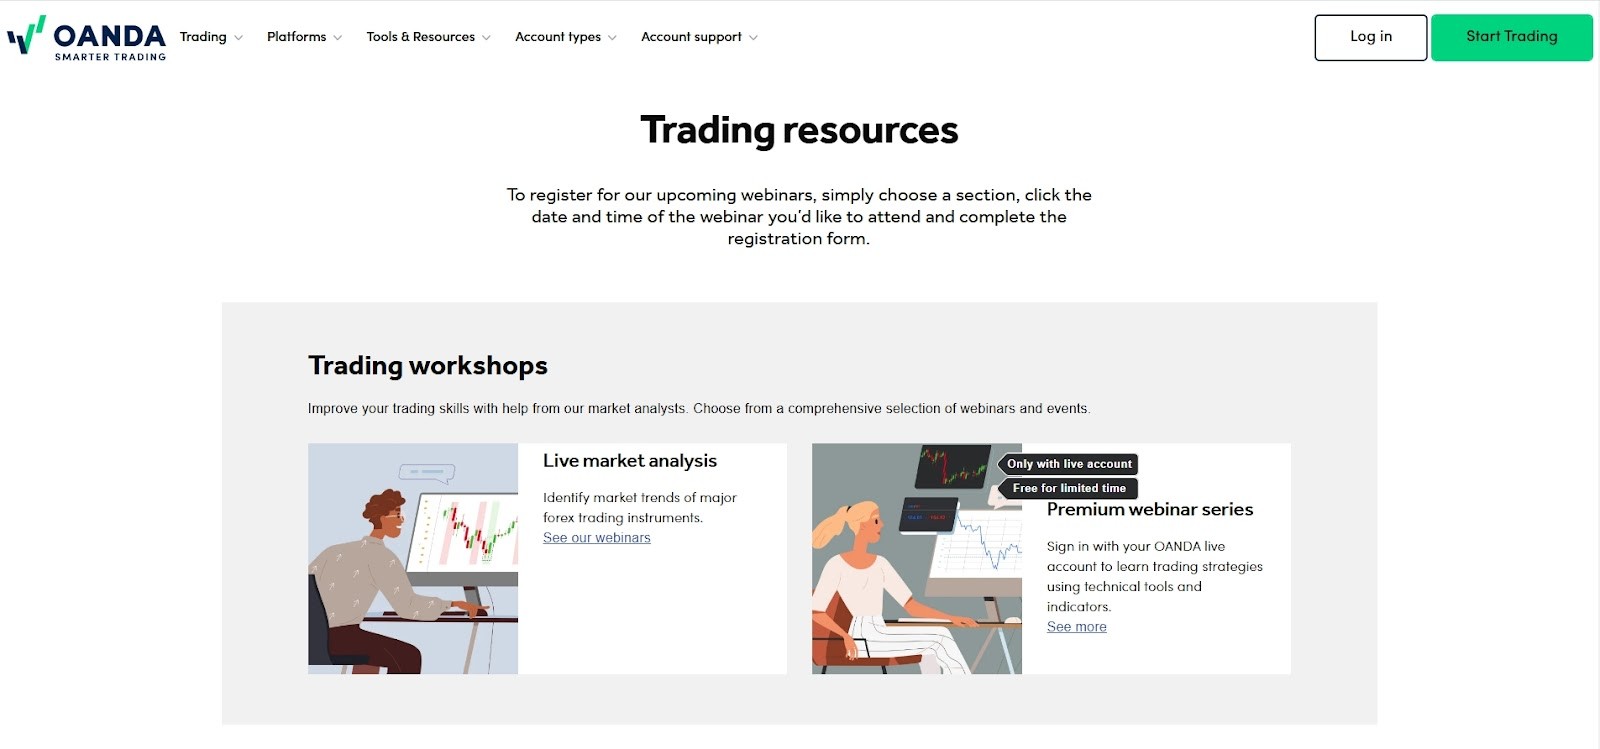
Visit the official OANDA website and go to the "Webinars" section.
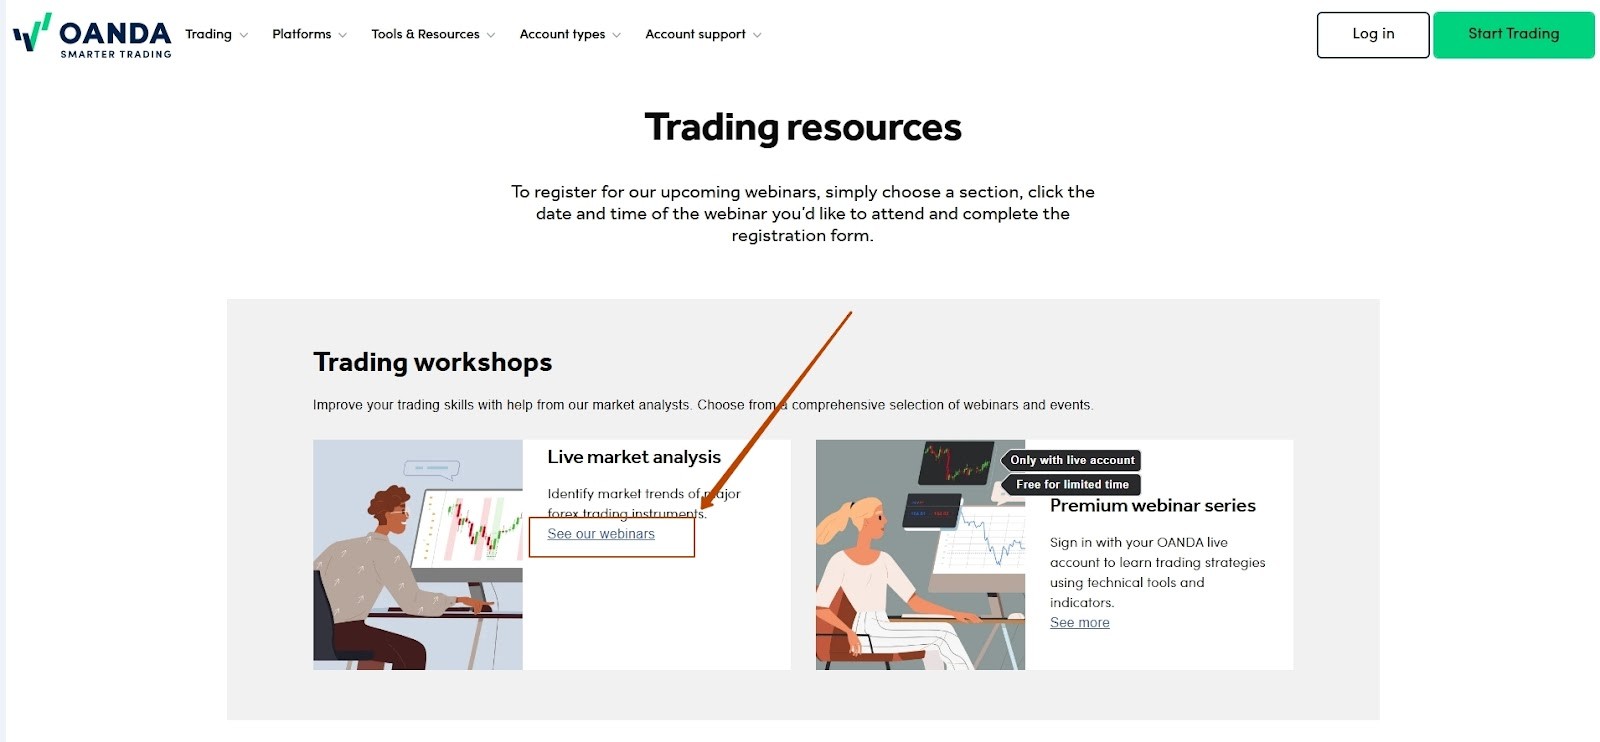
The section presents various webinar topics. Select the webinar you are interested in, paying attention to the date and time of the event.
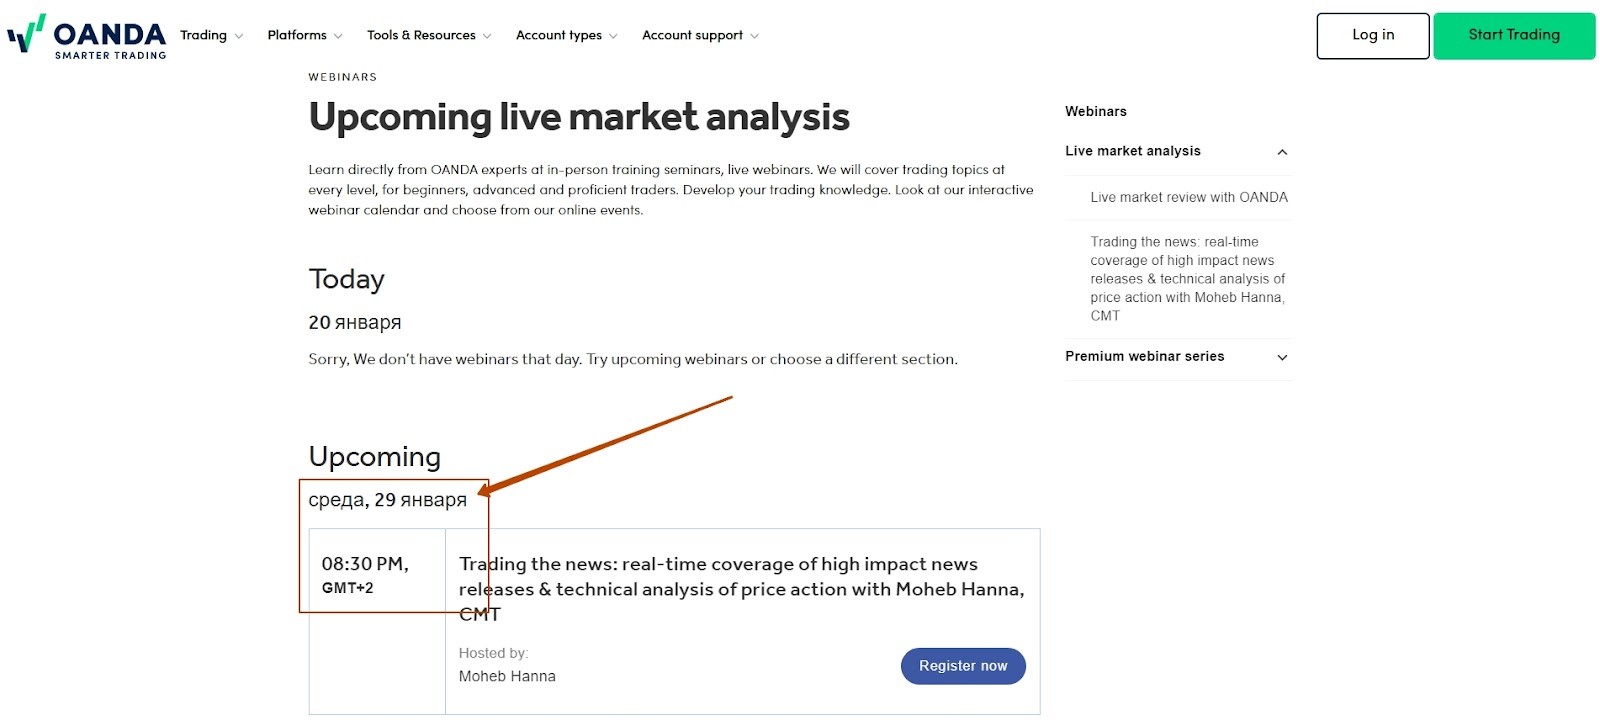
Click on the selected webinar, after which a page with detailed information and a registration form will open. Fill in the required fields, including your name and email address.
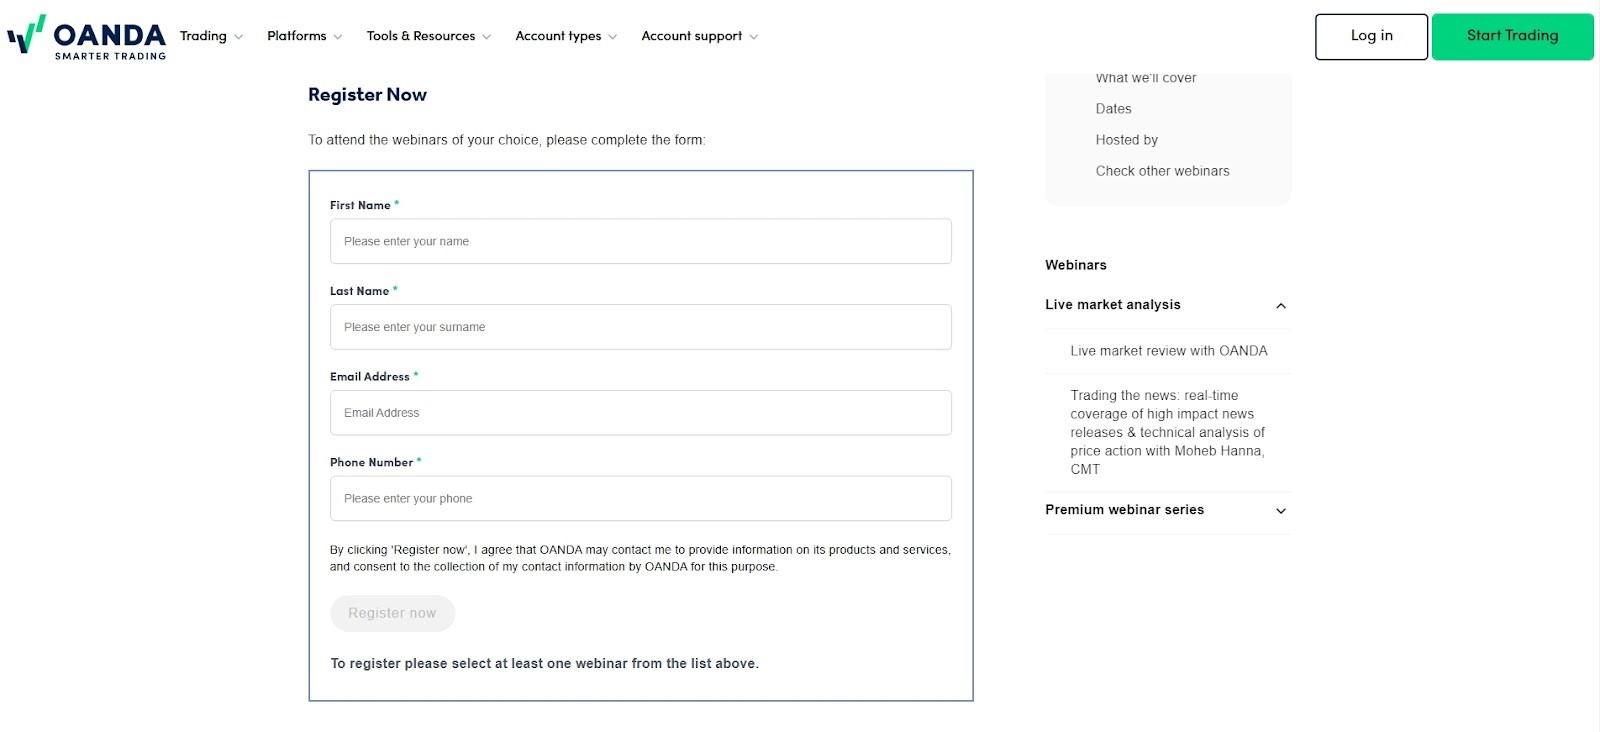
After submitting the form, you will receive a registration confirmation to the specified email address with further instructions on how to participate.
Access to trading tools
Log in to your account on the OANDA Trade platform. If you do not have an account, you can create one on the official website.
After logging in to the platform, select the "Advanced Charts" option. This feature provides access to more than 65 popular technical indicators, including moving averages, MACD, Bollinger Bands® and others.
In the "Technical Analysis" section, you can use the Autochartist tool, which automatically recognizes chart patterns and determines support and resistance levels.
Use the available tools to customize time intervals, overlay indicators and apply different types of charts for detailed analysis of price movements.
Using OANDA’s hidden tools to avoid costly trading mistakes

Most beginners rely on basic charts, but OANDA has tools that can give you a serious edge — if you know how to use them. One of the best-kept secrets is their order book, which shows where traders have placed their positions in real time. This isn’t just another indicator — it helps you see where most traders get stopped out, so you can avoid making the same mistake and adjust your entries accordingly.
Another tool traders overlook is OANDA’s historical spread data. Spreads aren’t fixed — they widen during news events and quiet hours, meaning you could be paying more than expected. By checking past spread behavior, you can time your trades to get better pricing and keep more profits instead of losing money on extra fees.
Conclusion
OANDA’s educational resources and tools offer traders an effective way to improve their knowledge and skills in Forex trading. Free webinars, analytical materials and access to advanced trading platforms make learning structured and practical. Tools such as advanced charting, technical analysis and automated trades help traders make informed decisions, analyze markets and adapt strategies to changing conditions.
For traders of all skill levels, OANDA’s resources provide a significant advantage. Beginner traders can use educational materials to master the basics of trading and develop their first strategies, while experienced users will find tools for in-depth market analysis and automation of their processes. The integration of education and trading on a single platform makes it easier to learn new knowledge and apply it in practice.
FAQs
How to choose a webinar that suits my level of experience?
If you are a beginner, choose webinars on basic topics, such as an introduction to trading or the basics of technical analysis. Experienced traders should pay attention to advanced topics: strategies, risk management, using advanced tools.
How to effectively use technical analysis tools?
Start with simple indicators, such as moving averages for trends, and oscillators (such as RSI) to identify overbought/oversold zones. Combine them with chart patterns to improve the accuracy of forecasts.
What data in the economic calendar require special attention?
Inflation reports, central bank decisions, and employment levels are especially important. These events have a strong impact on prices. Monitor the difference between forecasted and actual values to predict market reactions.
How to use historical data to improve your trading strategy?
Analyze historical quotes to test your strategy in different market conditions. This allows you to adapt your approach, eliminate weaknesses, and take into account the behavior of the asset in similar situations.
Related Articles
Team that worked on the article
Maxim Nechiporenko has been a contributor to Traders Union since 2023. He started his professional career in the media in 2006. He has expertise in finance and investment, and his field of interest covers all aspects of geoeconomics. Maxim provides up-to-date information on trading, cryptocurrencies and other financial instruments. He regularly updates his knowledge to keep abreast of the latest innovations and trends in the market.
Chinmay Soni is a financial analyst with more than 5 years of experience in working with stocks, Forex, derivatives, and other assets. As a founder of a boutique research firm and an active researcher, he covers various industries and fields, providing insights backed by statistical data. He is also an educator in the field of finance and technology.
As an author for Traders Union, he contributes his deep analytical insights on various topics, taking into account various aspects.
Mirjan Hipolito is a journalist and news editor at Traders Union. She is an expert crypto writer with five years of experience in the financial markets. Her specialties are daily market news, price predictions, and Initial Coin Offerings (ICO).

-
 Afghanistan
-
 Albania
-
 Algeria
-
 Argentina
-
 Armenia
-
 Australia
-
 Austria
-
 Azerbaijan
-
 Bahamas
-
 Bahrain
-
 Bangladesh
-
 Belgium
-
 Botswana
-
 Brazil
-
 Brunei
-
 Bulgaria
-
 Burma
Burma
-
 Cambodia
-
 Cameroon
-
 Canada
-
 Chile
Chile
-
 China
China
-
 Colombia
-
 Costa Rica
-
 Cote d'Ivoire
-
 Croatia
-
 Cyprus
-
 Czech Republic
-
 Denmark
-
 Dominican Republic
-
 Ecuador
-
 Egypt
Egypt
-
 Estonia
-
 Eswatini
-
 Ethiopia
-
 Finland
-
 France
-
 Georgia
-
 Germany
-
 Ghana
Ghana
-
 Greece
-
 Haiti
Haiti
-
 Hong Kong
-
 Hungary
-
 India
India
-
 Indonesia
-
 Iran, Islamic republic
-
 Iraq
Iraq
-
 Ireland
-
 Israel
-
 Italy
Italy
-
 Jamaica
-
 Japan
Japan
-
 Jordan
-
 Kazakhstan
-
 Kenya
Kenya
-
 Korea
Korea
-
 Kuwait
-
 Kyrgyzstan
-
 Laos
Laos
-
 Latvia
-
 Lebanon
-
 Libyan Arab Jamahiriya
-
 Lithuania
-
 Luxembourg
-
 Macedonia
-
 Madagascar
-
 Malaysia
-
 Malta
Malta
-
 Mauritius
-
 Mexico
-
 Moldova
-
 Mongolia
-
 Montenegro
-
 Morocco
-
 Mozambique
-
 Namibia
-
 Nepal
Nepal
-
 Netherlands
-
 Nigeria
-
 Norway
-
 Oman
Oman
-
 Pakistan
-
 Palestine
-
 Papua New Guinea
-
 Peru
Peru
-
 Philippines
-
 Poland
-
 Portugal
-
 Puerto Rico
-
 Qatar
Qatar
-
 Romania
-
 Rwanda
-
 Saudi Arabia
-
 Serbia
-
 Singapore
-
 Slovakia
-
 Slovenia
-
 Somalia
-
 South Africa
-
 Spain
Spain
-
 Sri Lanka
-
 Sweden
-
 Switzerland
-
 Syrian Arab Republic
-
 Taiwan
-
 Tajikistan
-
 Tanzania, United Republic Of
-
 Thailand
-
 Trinidad and Tobago
-
 Tunisia
-
 Turkey
-
 UAE
UAE
-
 Uganda
-
 Ukraine
-
 United Kingdom
-
United States
-
 Uzbekistan
-
 Venezuela
-
 Vietnam
-
 Yemen
Yemen
-
 Zambia
-
 Zimbabwe
- Forex
- Crypto
