Is Netflix Undervalued Or Overvalued After The Market Crash?


Editorial Note: While we adhere to strict Editorial Integrity, this post may contain references to products from our partners. Here's an explanation for How We Make Money. None of the data and information on this webpage constitutes investment advice according to our Disclaimer.
Netflix is priced like a high-growth stock, but its fundamentals tell a slower story. Subscriber growth is plateauing, content costs are rising, and the bulk of new users come from lower-revenue markets. While profitability and the ad tier have improved, the valuation leaves little room for mistakes, making the stock sensitive to any earnings disappointment.
Netflix’s valuation today depends on more than headline numbers or a single ratio. The real question is whether the company can still justify a premium price when subscriber growth is flattening and content spending keeps rising. Netflix has shifted from a pure growth story to a business focused on earnings, yet the market continues to treat it like it is expanding at full speed. That gap between actual performance and investor expectations is what makes NFLX’s valuation harder to read. The brand remains strong, but the fundamentals no longer support the same level of enthusiasm.
In this article, we break down the numbers, market sentiment, and strategic direction to help you decide whether Netflix is truly worth its current price or simply riding the wave of past glory.
Understanding Netflix
Netflix has been one of the most talked-about stocks of the last decade, but with its share price recovering strongly after a sharp drop in 2022, the big question is back on the table. Is Netflix overvalued? For long-term investors and casual traders alike, this is more than just a valuation debate. It is about understanding how a streaming giant balances growth, content costs, and changing viewer habits in a post-pandemic world.
With increasing competition from Disney, Amazon, and regional players, Netflix is no longer the only name in the game. Add to that rising content expenses, new pricing models, and macroeconomic pressures, and you get a complex picture that demands a closer look. Is the stock running ahead of its fundamentals, or does it still offer upside that the market is not fully pricing in?
Netflix's current market position
Netflix is now one of the biggest players in global entertainment. What started as a DVD rental business is now competing with some of the largest tech and media companies in the world. To figure out if the stock is worth its price today, we first need to understand where it stands in terms of subscribers, revenue, and investor attention.
Subscriber base and revenue growth
Netflix still leads when it comes to global subscribers, but how it makes money is starting to shift. Growth is slowing in places like the U.S., and the company is finding new ways to earn more from existing users.
The subscriber base is still Netflix’s strongest asset. The company now has more than 301 million paying users worldwide, and some estimates put the number closer to 310 million in early 2025. Growth continues to come mainly from Asia-Pacific and Latin America, while the United States and Canada are close to saturation. This shift matters because users in these faster-growing regions generate lower revenue per subscriber, which affects long-term earnings.
Revenue follows the same pattern. Netflix made more than 38 billion dollars in 2024, growing about 9% year over year. The increase came from higher average revenue per user, supported by the ad-supported tier and password-sharing limits. Pricing adjustments and currency changes also shaped results across key markets.
Netflix is shifting from fast subscriber growth to deeper monetization of its existing base. The strong rise in total users shows that global demand is still healthy, but most new sign-ups now come from lower-revenue regions. This makes future revenue growth more dependent on pricing, ads, and tighter cost control. The company is stronger and more profitable than before, but the path ahead relies less on expansion and more on financial discipline.
Stock performance and market capitalization
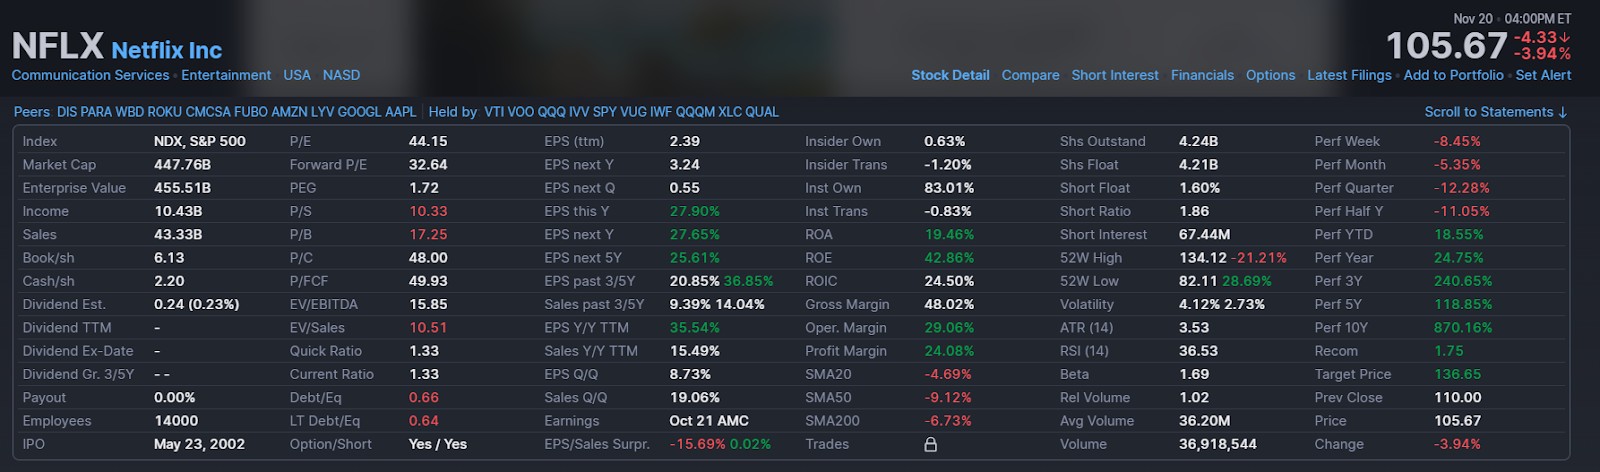
Netflix’s stock has been anything but boring. It crashed hard in 2022 but came roaring back thanks to better profits and new strategies. Using the latest data, Netflix is currently trading around $105, well below the highs it reached earlier in 2025. The stock has been under pressure recently, with performance showing short-term weakness. Over the last week, the stock is down 8.45%, and over the past month it has dropped 5.35%, despite being up 24.75% year-over-year. Netflix’s 52-week range sits between $82 and $134, highlighting the volatility the stock has seen as investor sentiment shifts.
Netflix’s valuation still reflects a premium despite the pullback. Its forward P/E ratio is 32.64, notably higher than traditional media companies that typically trade between 12x and 18x earnings. The company’s price-to-sales ratio is 10.51, far above sector averages, signaling that investors are continuing to price in meaningful long-term growth and monetization potential.
With a market cap of $447.76 billion and an enterprise value of $455.51 billion, Netflix remains one of the highest-valued entertainment companies globally, even though growth has slowed and competition is intensifying.
Netflix is still priced as a premium streaming leader, even after the recent selloff. Investors continue to value its profitability, global reach, and potential upside from new monetization channels like advertising. But the stock’s elevated valuation leaves little room for disappointment. With the share price weakening and fundamentals normalizing, Netflix now has to consistently deliver strong results to justify this premium; otherwise further downward adjustments are likely.
Valuation of Netflix
To understand whether Netflix is overvalued, we need to look beyond the buzz and dig into what the numbers actually say. This means studying the fundamentals, estimating intrinsic value, and checking the technical signals that traders and investors use. Together, these views offer a fuller picture of how the market is pricing Netflix and whether the stock’s current level is justified.
Netflix fundamental analysis
Valuation ratios help investors decide whether a stock like Netflix is priced fairly compared to its earnings and future growth. Alongside that, financial health indicators such as margins and free cash flow show how well the business is managing its money. Together, these figures can help reveal if Netflix’s current stock price is justified or stretched.
Price to earnings (P/E) ratio
Netflix now trades at a forward P/E of 32.64 and a trailing P/E of 44.15, which places the company well above the valuation range of traditional media firms that typically fall between 12x and 18x. These higher multiples show that investors are still treating Netflix as a growth-driven business rather than a mature entertainment company. The valuation reflects confidence in stronger earnings, better monetization, and continued global reach.
A P/E ratio above 30 signals that the market expects steady profit expansion and believes Netflix can keep improving margins through pricing, ads, and better control over content spending. It also means the stock carries higher sensitivity to earnings results. If subscriber trends soften or costs rise faster than expected, the valuation can come under pressure more quickly than lower-multiple peers.
What this means right now: Netflix is trading at a premium. That is fine if growth continues, but any slowdown could make the valuation look too expensive.
Price to earnings growth (PEG) ratio
Netflix’s PEG ratio, estimated between 1.5 and 1.8, shows how the stock is valued once its expected earnings growth is taken into account. A PEG above 1 usually suggests that the valuation may be ahead of the company’s growth pace. For Netflix, it reflects faith in its ability to expand profits through better margins, stronger pricing power, and new revenue sources like advertising. It also shows that expectations are already high. If future earnings rise more slowly than projected, the valuation could begin to look stretched.
Investor takeaway: Netflix’s PEG is on the higher side, suggesting that the stock might be priced a bit aggressively for its current growth rate.
Operating margins and free cash flow
Based on the latest data, Netflix’s operating margin is around 29.06%, which is significantly higher than the levels seen a few years ago when margins were closer to the mid-teens. Profit margin sits at 24.08%, reflecting strong cost discipline and better monetization from pricing changes and the ad-supported tier. The P/FCF ratio shown as 49.93 implies free cash flow of roughly 9 billion dollars, using the market cap of 447.76 billion dollars. That places Netflix solidly in the positive cash flow category after many years of heavy spending that kept free cash flow negative.
These updated numbers show that Netflix has transitioned from a cash-burning growth company into a mature, profit-generating business with healthier margins and significantly improved cash efficiency. Rising profitability gives Netflix more flexibility to invest in content, expand internationally, and support new revenue models without relying heavily on debt. It also means the company can absorb short-term volatility more comfortably than in the past.
For years, Netflix was criticized for spending more than it earned. Today, the shift to profitability and solid cash generation makes the company more resilient and attractive to a wider range of investors.
Netflix intrinsic valuation
Intrinsic valuation tries to estimate what Netflix is really worth today based on its expected future cash flows, not just what the market is willing to pay.
Discounted cash flow (DCF) estimates
Using updated inputs that assume revenue growth of 8 to 10 percent and operating margins stabilizing near the current 29 percent range, most DCF models value Netflix between 88 and 92 dollars per share. With the stock trading at 105 dollars, Netflix appears to be roughly 15 to 20% above its modeled intrinsic value. This premium reflects optimism around stronger free cash flow, global expansion, and the potential of the ad-supported tier.
Other valuation models
Relative valuation also supports the view that Netflix is trading at a premium. The company’s EV to EBITDA ratio of 15.85 is higher than most traditional media peers. The P/FCF ratio of 49.93 suggests the market assigns a high value to each dollar of free cash flow. Netflix’s PEG ratio of 1.72 indicates that investors are already pricing in meaningful earnings growth, leaving less room for slower expansion.
Across DCF models and market multiples, Netflix appears modestly overvalued at current levels. Improved margins and strong free cash flow have made the valuation more defensible than in past years, but the stock still depends heavily on consistent execution in advertising, stable subscriber monetization, and disciplined content spending. Any slowdown in these areas could make the premium harder to justify.
Netflix technical analysis
Technical analysis looks at stock price charts, patterns, and momentum indicators to see what the short-term trend might be.
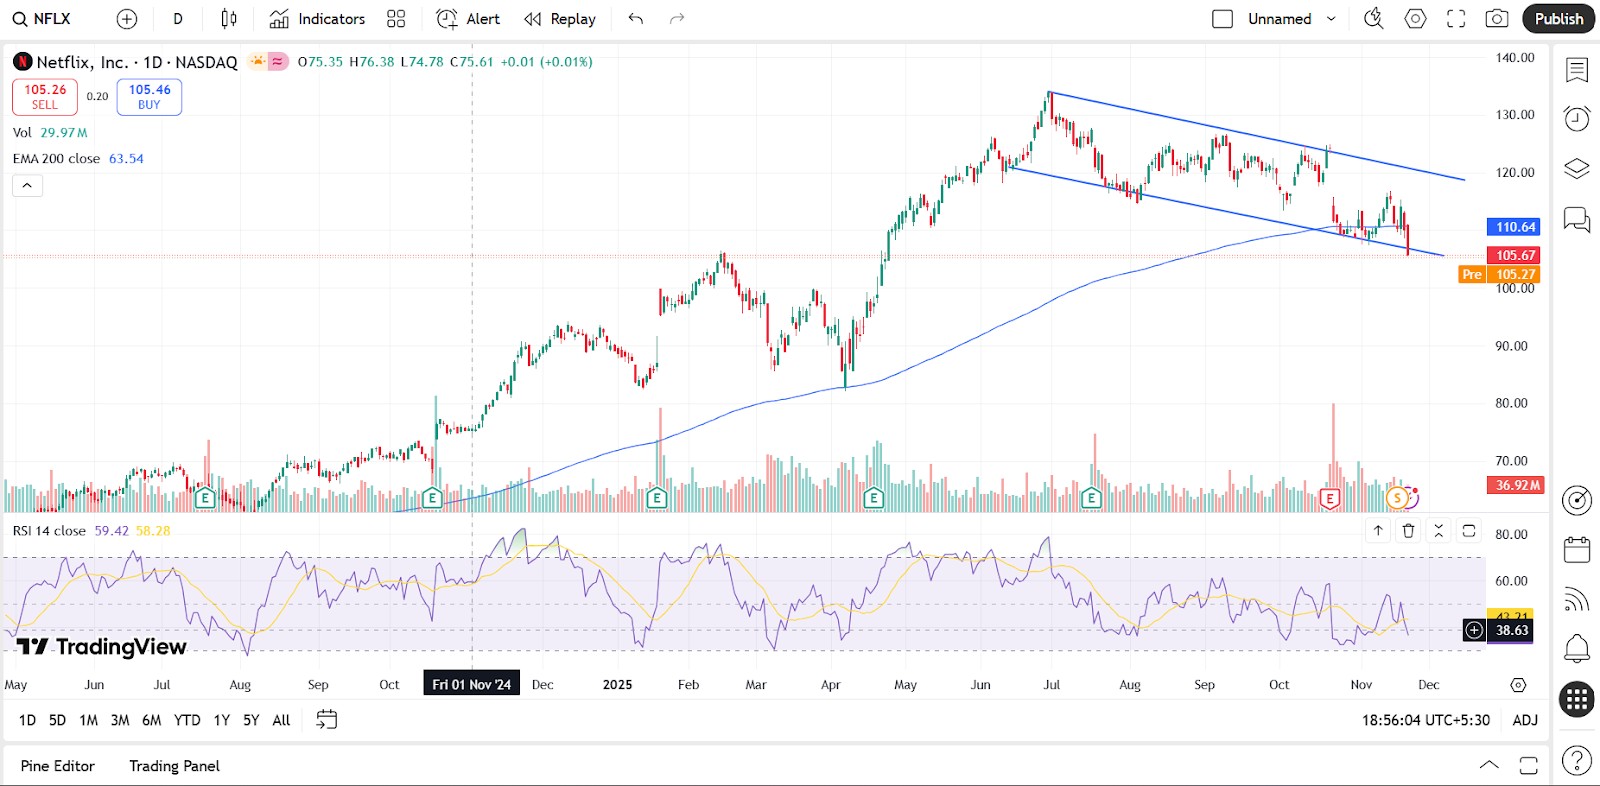
Netflix is trading near $105 to $106, sitting inside a clear downward channel that has been forming since mid-2024. The price recently broke below the mid-range of this channel and is now testing support near $105, which aligns with the recent cluster of lows on your chart. The stock is trading below the 200-day moving average, which sits near $110.50, signaling a weak long-term trend. RSI is around 38, showing the stock is close to oversold territory and may see a short-term bounce if buyers step in.
The trend remains bearish, with lower highs forming consistently from August to November. The stock continues to respect the upper boundary of the downward channel, and recent candles show selling pressure rising on high volume. Until Netflix breaks above the channel and the 200-day moving average, the broader trend stays weak.
Short-term traders are watching the $103 to $105 support zone closely. A breakdown below this level could open the door to a move toward $100. Long-term investors may wait for a close above $112 to $115, which would signal the first meaningful shift in momentum. RSI near oversold levels suggests that a short rebound is possible, but the overall trend still favors caution.
Analyst perspectives and market sentiment
Analyst opinions on Netflix are split, with some backing the company’s evolving business model while others remain cautious about its high valuation. Market sentiment has also shifted in recent years, influenced by stronger fundamentals, changing subscriber dynamics, and broader tech market trends. This section explores the mix of optimism and concern, along with where analysts think the stock is heading next.
Bullish viewpoints
Supporters of Netflix argue that the company has successfully moved beyond just subscriber growth and is now building stronger earnings through smarter pricing, ad revenues, and better cost management.
Why some analysts are bullish:
Ad-supported tier potential. Analysts at JPMorgan and BofA believe that Netflix’s ad tier could unlock over $5 billion in additional annual revenue within the next few years.
Improved margins. With operating margins now above 20 percent, bullish firms see Netflix becoming more efficient and profitable, not just growing in size.
Content advantage. Despite competition, Netflix still leads in global content spend and has one of the most watched libraries worldwide, including global hits like Squid Game and The Night Agent.
First-mover resilience. Many analysts believe Netflix’s brand, distribution, and tech infrastructure give it a long-term edge over newer rivals.
Netflix is no longer chasing just user numbers. It is monetizing better, managing costs smarter, and setting itself up for long-term margin growth.
Bearish viewpoints
On the other side, some analysts question whether Netflix’s recent run-up in stock price is sustainable, especially given rising competition and the high expectations already built into its valuation.
Common concerns raised:
Valuation stretch. Firms like UBS and CFRA point out that Netflix trades at 30x to 35x forward earnings, well above historical averages for media companies.
Content spending pressure. The company still spends $17 billion per year on content, which could become a burden if subscriber or ad revenue slows.
Saturation risk. Growth is slowing in mature markets like North America, and the company may have limited room to raise prices further without increasing churn.
Ad business uncertainty. While promising, some analysts argue that Netflix entered the ad game late and will struggle to catch up with established platforms like YouTube.
Netflix may be overreaching, and the stock is pricing in too much success too soon. A few missteps in subscriber growth or ad revenue could trigger a sharp correction.
| Year | Price in the middle of the year | Price at the end of the year |
|---|---|---|
| 2026 | $76 | $73 |
| 2027 | $70 | $66 |
| 2028 | $93 | $93 |
| 2029 | $98 | $100 |
| 2030 | $140 | $160 |
| 2031 | $190 | $240 |
| 2032 | $240 | $250 |
| 2033 | $350 | $340 |
| 2034 | $410 | $370 |
| 2035 | $200 | $210 |
| 2036 | $300 | $410 |
| 2037 | $550 | $83 |
| 2038 | $58 | $47 |
| 2039 | $66 | $65 |
| 2040 | $62 | $59 |
Consensus and price targets
Analysts currently rate NFLX as a Buy on average. The latest data shows an average 12-month price target of around $134, with typical targets ranging from about $95 at the low end to around $160 at the high end. Given the current share price near $105, that implies an upside of roughly 25-30%. The spread of targets, some below current price, some far above, reflects uncertainty about Netflix’s ability to deliver strong earnings growth while managing rising content costs and slowing subscriber gains in key markets.
Most analysts agree that Netflix is in a stronger position today than it was two years ago. Still, investors should be prepared for fluctuations, especially as new revenue models are tested and international markets evolve.
If this valuation review helps shape your view of the stock, the next step is simply finding a reliable place to invest. The list of best stock brokers for investing in stocks below makes that easier by offering a few dependable platforms you can consider before taking any position.
| eToro USA | Plus500 | eOption | Revolut | Fidelity | |
|---|---|---|---|---|---|
|
Stocks |
Yes | Yes | Yes | Yes | Yes |
|
Foundation year |
2007 | 2008 | 2007 | 2015 | 1946 |
|
Account min. |
50 | EUR500 | No | No | No |
|
Demo |
Yes | Yes | Yes | No | Yes |
|
Research and data |
Yes | Yes | Yes | Yes | Yes |
|
Basic stock/ETF fee |
No | $0.006 | $0 | 0.12%-0.25% | No |
|
Deposit Fee |
No | No | Not specified | No | $0 |
|
Withdrawal fee |
No | No | Not specified | No charge up to a limit | $0 |
|
Regulation |
SEC, FINRA | CySEC, FCA, ASIC, FMA, FSCA, FSA Seychelles, EFSA, MAS, DFSA, SCB | FINRA, SIPC | FCA, SEC, FINRA | SEC, FINRA |
|
TU overall score |
8.8 | 8.55 | 8.2 | 8.69 | 8.53 |
|
Open an account |
Go to broker Your capital is at risk. |
Go to broker 80% of retail CFD accounts lose money. |
Study review | Study review | Study review |
Netflix News
Why is Netflix stock down today?
Netflix stock declines as defamation lawsuit filed by Tyra Banks triggers sell-off
Why is Netflix stock down today?
What is behind Netflix stock's recent gain in value today
+3.03% for Netflix stock as institutional support lifts prices
Large insider sale by Reed Hastings drives Netflix stock down 3.01%
Why Netflix’s valuation could collapse without warning

What makes Netflix vulnerable right now is how much of its valuation depends on assumptions that are no longer guaranteed. Investors still treat the company as if it has a clear lead in streaming, yet that lead is shrinking quietly.
Competitors are improving their content libraries, bundling strategies are getting stronger, and several platforms now offer free or nearly free ad-supported models. If Netflix adjusts pricing or spends more to defend its position, earnings get pressured even if subscriber totals remain stable. Once the focus shifts from user growth to profit quality, the valuation can reset quickly.
There is also a regional imbalance that many overlook. Growth is coming from markets that generate far less revenue per user, while higher-value regions like the United States and Europe have slowed sharply. That creates a long-term challenge for average revenue per member. If more users join from low-paying countries while churn rises in premium markets, the overall revenue trajectory flattens. This is a risk that does not show up immediately on the top-line numbers, but it matters deeply when the stock trades at a valuation that assumes steady expansion in profitability.
Conclusion
Netflix’s lofty valuation continues to demand scrutiny as growth decelerates and content spending soars. While the company remains a pioneer in streaming and boasts impressive subscriber numbers, these strengths are increasingly offset by market saturation and fierce competition from both established and emerging platforms. The premium price tag reflects optimism about sustained dominance, yet recent revenue and margin pressures suggest caution is warranted. Ultimately, investors must weigh whether Netflix’s brand power justifies such a high multiple, or if the stock’s best days are now behind it. In high-stakes streaming, paying any price for leadership could prove an expensive lesson.
FAQs
How does rising content spending influence Netflix’s long-term valuation prospects?
What role do new revenue streams, such as advertising, play in Netflix’s overall business model?
Why is Netflix’s stock considered sensitive to earnings surprises compared to other media companies?
How do shifting subscriber demographics affect Netflix’s future earnings potential?
Editors' Top Picks and Insights

Intel's comeback: Apple, Trump and the AI bet

Bitcoin price prediction based on RSI: Is BTC poised for a new rally?

Toncoin becomes Gram: Why Durov restored token's original name

Why Tether flipping Ethereum is a pivotal moment for crypto

MiCA deadline: Why crypto companies are leaving Europe

From “Holy Trinity” to WLD crash: How Arthur Hayes became a market-moving seller
Related Articles
Team that worked on the article
Ashutosh Sureka is a finance professional specializing in financial research, credit assessment, and equity analysis.
Dan Blystone began his trading career in 1998 as an arbitrage clerk on the floor of the Chicago Mercantile Exchange (CME). He later traded bond and Eurex futures at proprietary firms such as Altea Trading, gaining valuable experience in high-frequency trading and risk management.
Chinmay Soni is a financial analyst with more than 5 years of experience in working with stocks, Forex, derivatives, and other assets. As a founder of a boutique research firm and an active researcher, he covers various industries and fields, providing insights backed by statistical data.
Bitcoin is a decentralized digital cryptocurrency that was created in 2009 by an anonymous individual or group using the pseudonym Satoshi Nakamoto. It operates on a technology called blockchain, which is a distributed ledger that records all transactions across a network of computers.
Volatility refers to the degree of variation or fluctuation in the price or value of a financial asset, such as stocks, bonds, or cryptocurrencies, over a period of time. Higher volatility indicates that an asset's price is experiencing more significant and rapid price swings, while lower volatility suggests relatively stable and gradual price movements.
Day trading involves buying and selling financial assets within the same trading day, with the goal of profiting from short-term price fluctuations, and positions are typically not held overnight.
Diversification is an investment strategy that involves spreading investments across different asset classes, industries, and geographic regions to reduce overall risk.
CFD is a contract between an investor/trader and seller that demonstrates that the trader will need to pay the price difference between the current value of the asset and its value at the time of contract to the seller.

-
 Afghanistan
-
 Albania
-
 Algeria
-
 Angola
-
 Argentina
-
 Armenia
-
 Australia
-
 Austria
-
 Azerbaijan
-
 Bahamas
-
 Bahrain
-
 Bangladesh
-
 Belarus
-
 Belgium
-
 Bolivia
-
 Botswana
-
 Brazil
-
 Brunei
-
 Bulgaria
-
 Cambodia
-
 Cameroon
-
 Canada
-
 Chile
Chile
-
 China
China
-
 Colombia
-
 Congo
Congo
-
 Costa Rica
-
 Cote d'Ivoire
-
 Croatia
-
 Cuba
Cuba
-
 Cyprus
-
 Czechia
-
 DR Congo
-
 Denmark
-
 Dominican Republic
-
 Ecuador
-
 Egypt
Egypt
-
 El Salvador
-
 Estonia
-
 Eswatini
-
 Ethiopia
-
 Finland
-
 France
-
 Georgia
-
 Germany
-
 Ghana
Ghana
-
 Greece
-
 Haiti
Haiti
-
 Hong Kong
-
 Hungary
-
 India
India
-
 Indonesia
-
 Iran, Islamic republic
-
 Iraq
Iraq
-
 Ireland
-
 Israel
-
 Italy
Italy
-
 Jamaica
-
 Japan
Japan
-
 Jordan
-
 Kazakhstan
-
 Kenya
Kenya
-
 Korea
Korea
-
 Kuwait
-
 Kyrgyzstan
-
 Laos
Laos
-
 Latvia
-
 Lebanon
-
 Lesotho
-
 Libya
Libya
-
 Lithuania
-
 Luxembourg
-
 Madagascar
-
 Malaysia
-
 Malta
Malta
-
 Mauritius
-
 Mexico
-
 Moldova
-
 Mongolia
-
 Montenegro
-
 Morocco
-
 Mozambique
-
 Myanmar
-
 Namibia
-
 Nepal
Nepal
-
 Netherlands
-
 New Zealand
-
 Nigeria
-
 North Macedonia
-
 Norway
-
 Oman
Oman
-
 Pakistan
-
 Palestine
-
 Panama
-
 Papua New Guinea
-
 Paraguay
-
 Peru
Peru
-
 Philippines
-
 Poland
-
 Portugal
-
 Puerto Rico
-
 Qatar
Qatar
-
 Reunion
-
 Romania
-
 Rwanda
-
 Saudi Arabia
-
 Serbia
-
 Singapore
-
 Slovakia
-
 Slovenia
-
 Somalia
-
 South Africa
-
 Spain
Spain
-
 Sri Lanka
-
 Sweden
-
 Switzerland
-
 Syria
Syria
-
 Taiwan
-
 Tajikistan
-
 Tanzania
-
 Thailand
-
 Trinidad and Tobago
-
 Tunisia
-
 Turkey
-
 UAE
UAE
-
 Uganda
-
 Ukraine
-
 United Kingdom
-
United States
-
 Uruguay
-
 Uzbekistan
-
 Venezuela
-
 Vietnam
-
 Yemen
Yemen
-
 Zambia
-
 Zimbabwe
- Forex
- Crypto
