How To Predict Next Candlestick In Binary Trading


Editorial Note: While we adhere to strict Editorial Integrity, this post may contain references to products from our partners. Here's an explanation for How We Make Money. None of the data and information on this webpage constitutes investment advice according to our Disclaimer.
To predict the next candlestick in binary trading, follow these key techniques:
Understanding candlestick patterns – identify formations like Doji, engulfing, and pin bars to anticipate price movement.
Use technical indicators – apply RSI, moving averages, Bollinger Bands, and MACD to confirm market signals.
Analyze market trends – determine if the market is trending or ranging to adjust your trading strategy.
Pick the right time frame – choose short-term charts for quick trades or higher time frames for trend confirmation.
Binary options trading needs a good grasp of market trends, price movements, and technical indicators. Predicting candle direction is key to better trades. Studying candlestick patterns and trends helps traders trade smarter. Here's how to do it effectively.
Risk warning: Binary options trading is highly risky and may result in a total loss of funds. These speculative instruments often lack strong regulation, with over 80% of traders losing their capital. Invest only what you can afford to lose and seek professional advice.
How to predict next candlestick in binary trading
Understanding candlestick patterns
Candlestick patterns are essential tools for traders who want to predict price movements in binary options. Each candle represents price action over a specific time frame and consists of four main components.
Here’s how open, high, low, and close prices can reveal trader behavior in ways most people miss.
Open price traps. The opening price often tricks traders into thinking a trend has started, especially in volatile markets. Big players set traps to trigger stop-losses before reversing the trend.
High price exhaustion. A candle’s high isn’t just a peak; it shows whether buyers still have strength. If the price hits a high but quickly pulls back, it shows big traders cashing out, not real buying pressure.
Low price deception. A candle’s low can be a fake-out. When the price dips and recovers fast, it often means big traders dip the price to grab cheap orders before moving higher.
Close price psychology. The closing price is the real story. If a candle closes near its high after a weak start, it’s a sign that buyers are taking control, but many traders miss it.
Recognizing common candlestick patterns can help traders predict future price movements. Some of the most reliable patterns include:
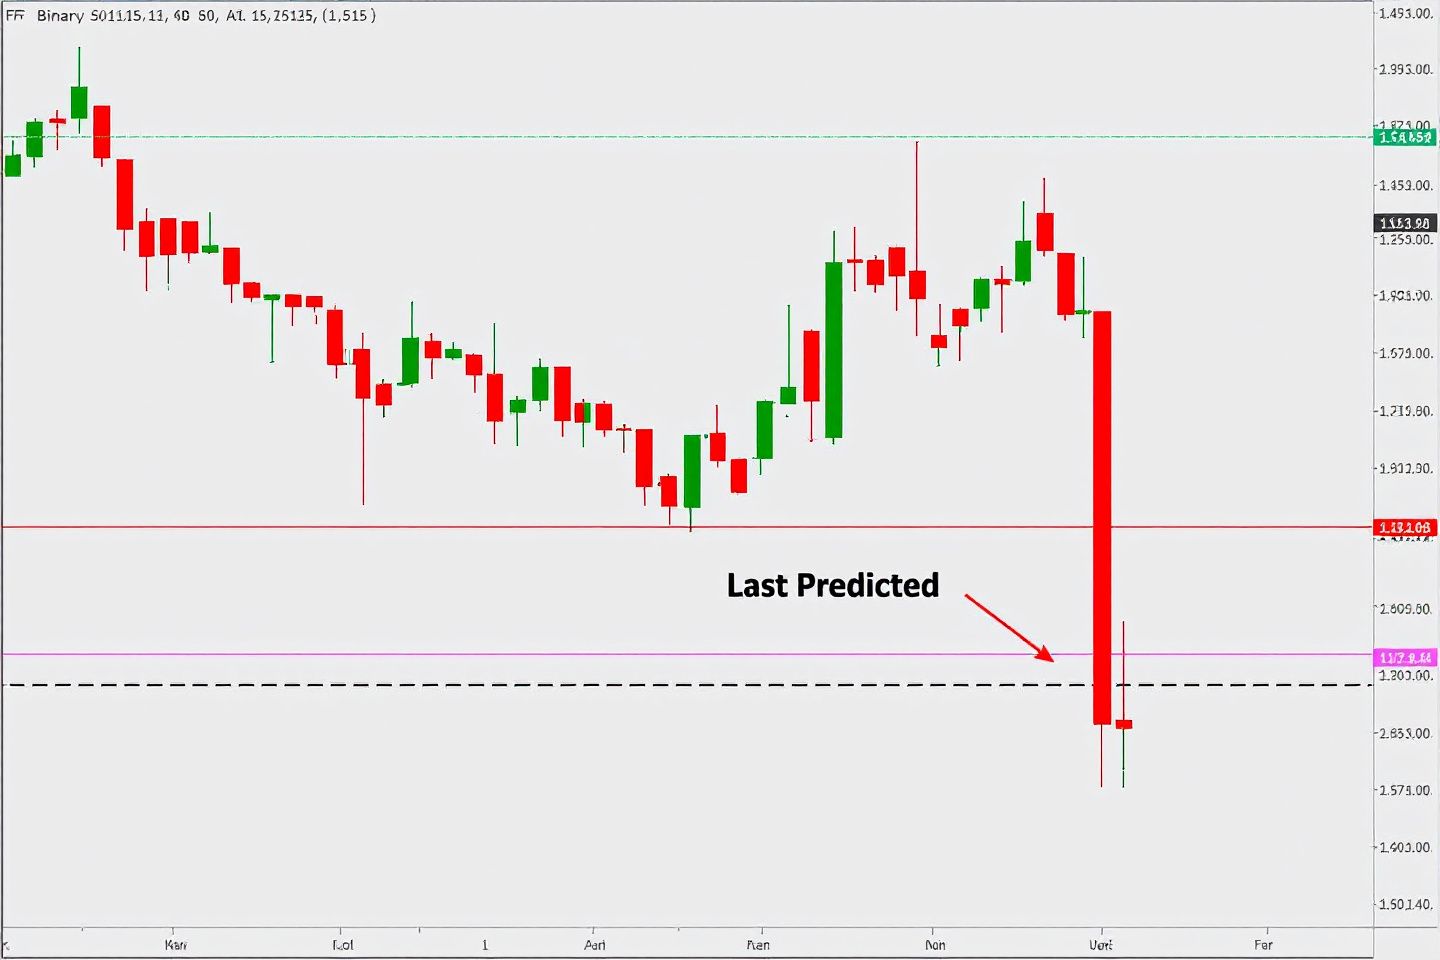
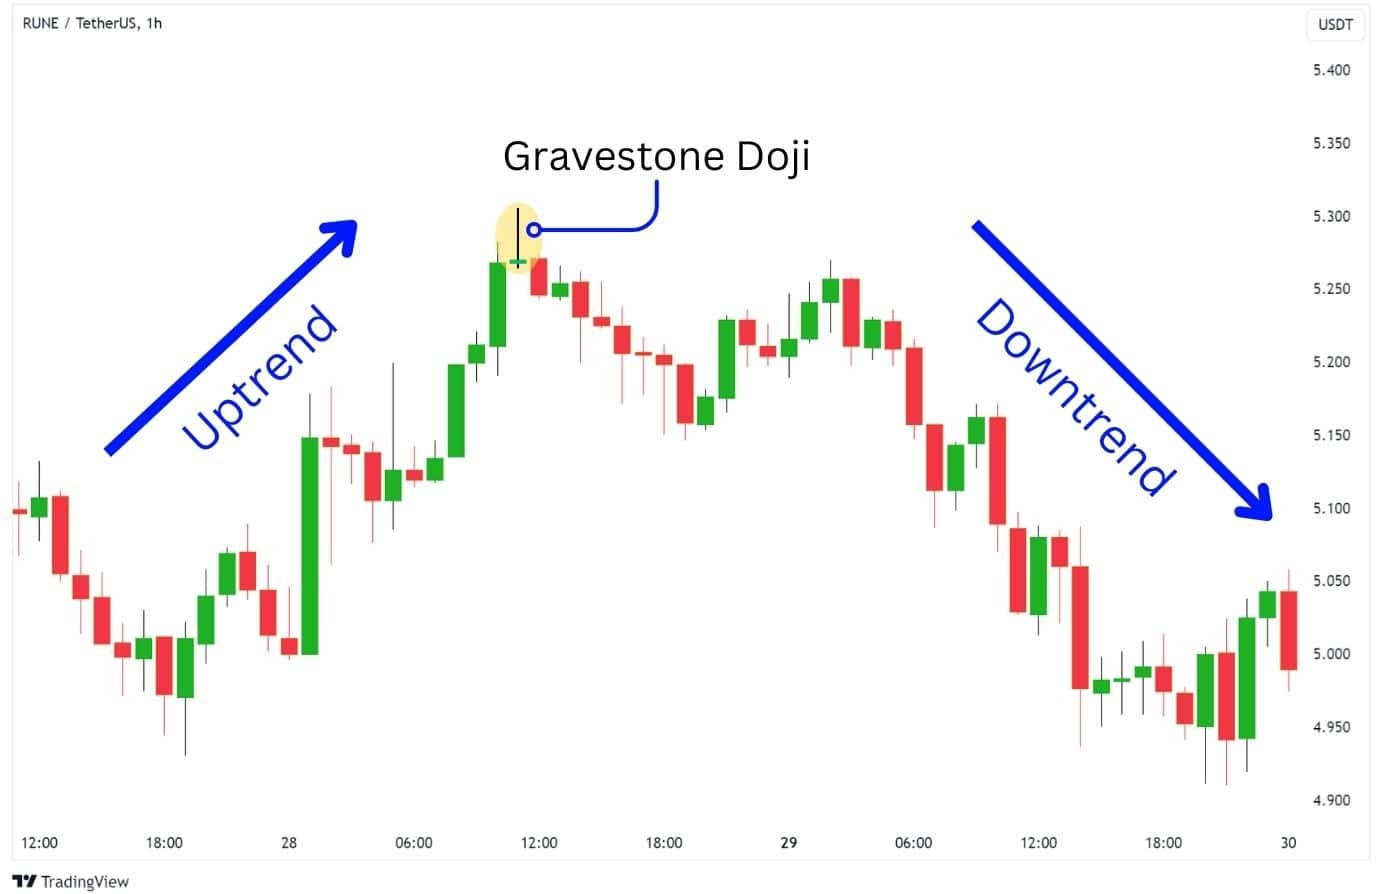
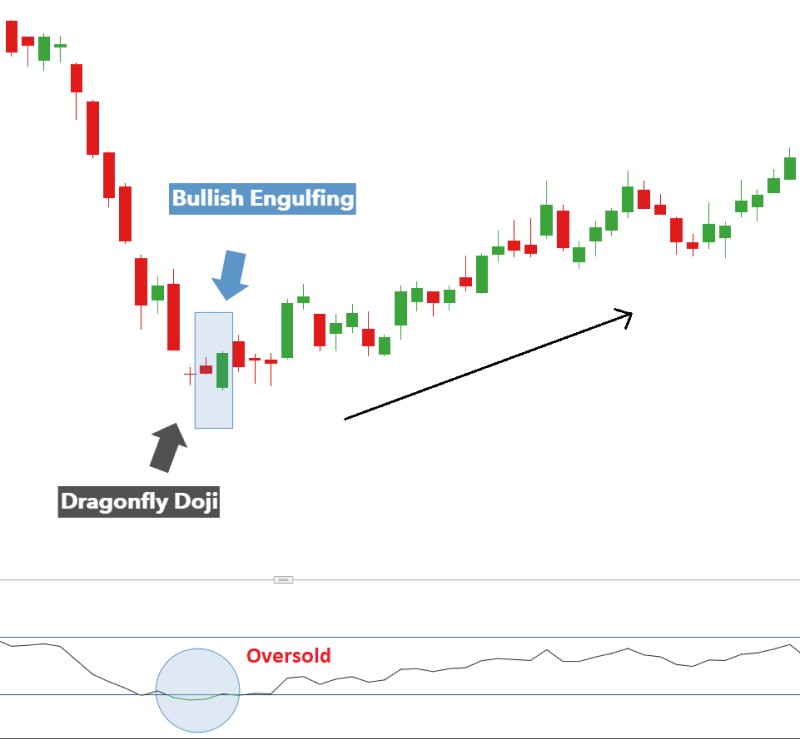
Doji candlestick. A Doji is more than just indecision — it’s where big traders test the market. Big players often use Dojis to mislead smaller traders. Most beginners see a Doji as neutral, but its location is what really matters. If a Doji forms at resistance after a strong rally, big traders might be cashing out while smaller traders keep buying, which often leads to a sharp drop. On the other hand, if a Doji appears at support, it doesn’t always mean the price will bounce — it could be big players setting up their next move.
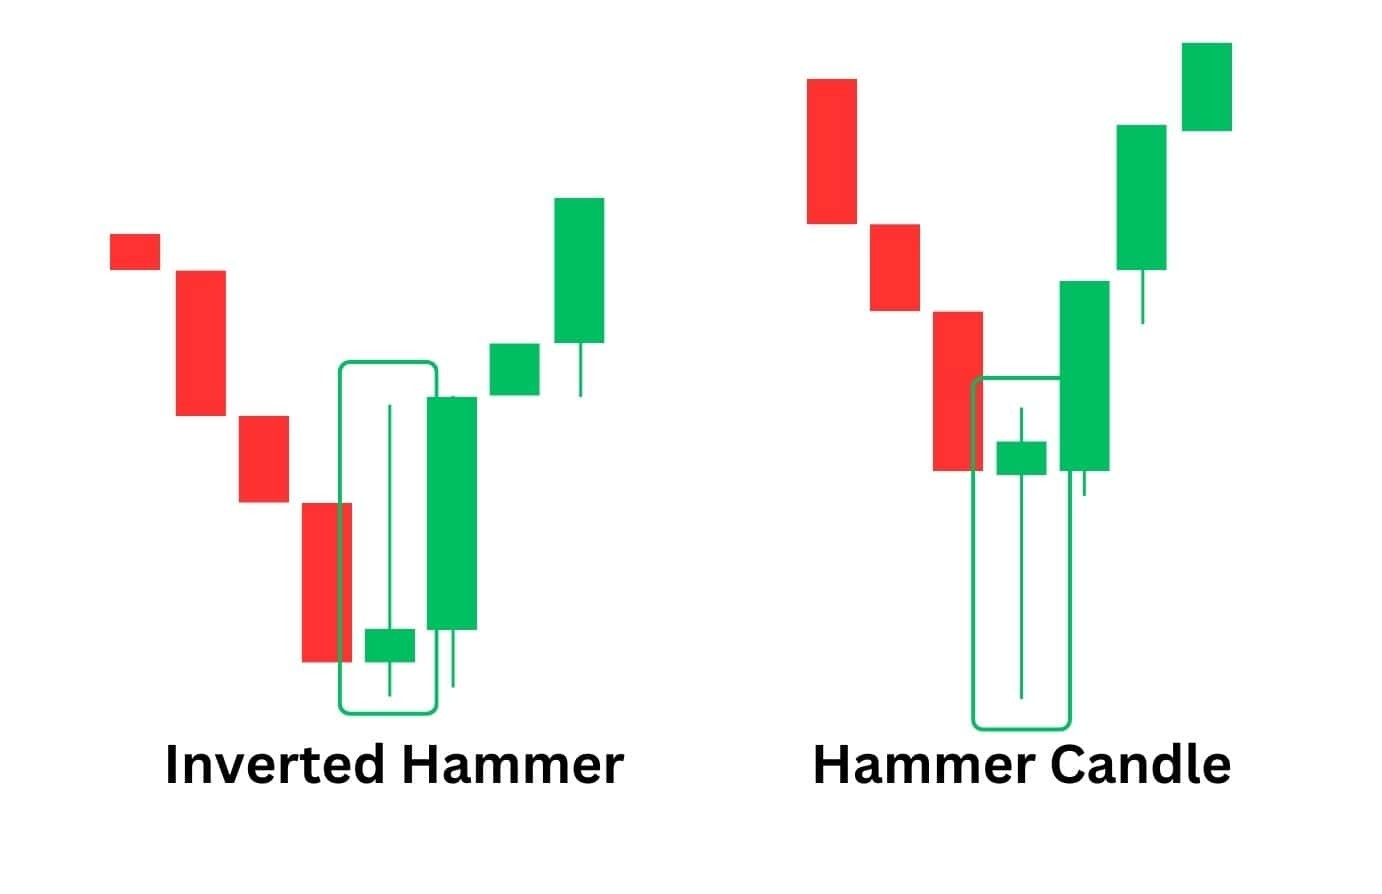
Hammer and inverted hammer. Many traders think hammers and inverted hammers are just reversal patterns, but what really matters is how they trap traders. A hammer at the bottom of a downtrend usually means large traders push the price down to trigger panic selling. If the next candle opens higher and stays above the wick, it shows bigger traders are buying up all the cheap sell orders before pushing the price higher. An inverted hammer at resistance works the same way in reverse — if the price briefly breaks higher but closes weak, experienced traders use this to sell to emotional buyers. The key isn’t just spotting the pattern but watching how the next candle reacts. This is where many traders get tricked into taking the wrong trade.
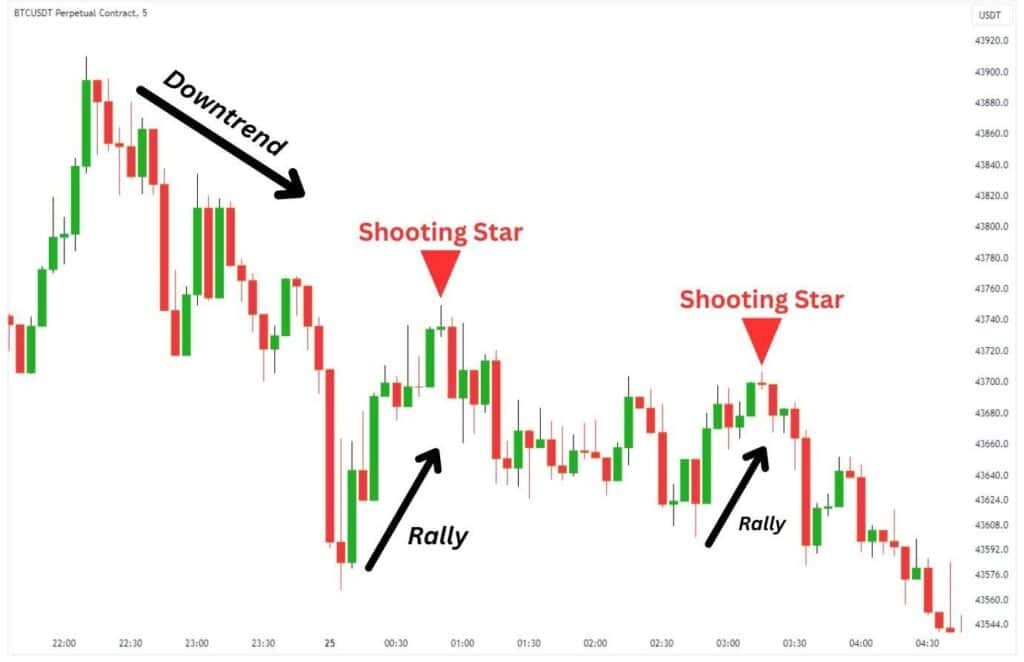
Shooting star. Many traders assume a shooting star is just a bearish reversal, but here’s the catch: the wick length shows who got trapped. If it’s long with a small body, buyers tried to push higher but got shut down by heavy selling. The key detail? Watch the next few candles. If price stays below the close, weak buyers are stuck, and a drop is likely. But if price retests the wick’s midpoint and holds, large traders could be scooping up orders — flipping the expected reversal into a trap.
Engulfing pattern. Most traders think the engulfing pattern is just a basic reversal signal, but what really matters is why it happens. A bullish engulfing candle isn’t just a big green bar covering a red one — it’s about big players grabbing liquidity. They push the price below the previous candle’s low before buying up orders, forcing small traders to exit. The more dramatic the engulfing, the more traders get caught on the wrong side, fueling the next move. A strong engulfing setup only works well in key price zones where liquidity is stacked.
Morning and evening star. Most traders think the morning and evening star patterns are just signal reversals, but the real strength of these patterns is in where they appear. A morning star has more impact than one after a sudden fall — because it tells you sellers are fading out slowly, not just reacting to a dip. Similarly, an evening star works best when the market is slowly climbing with low volatility, as it catches buyers off guard. The second candle’s size isn’t just confirmation; if it’s tiny, traders are hesitating, making the last candle’s move even more important. Many overlook volume, but when a morningstar forms with high volume on the third candle, big traders are likely entering the market.
Using technical indicators
Technical indicators help traders confirm candlestick signals and improve accuracy in predicting candle direction. Some commonly used indicators include:
Moving Averages (MA). - Simple Moving Average (SMA) and Exponential Moving Average (EMA) identify trends. - When the price is above the moving average, it suggests an uptrend, while a price below the moving average signals a downtrend.
Relative Strength Index (RSI). - RSI measures market momentum. - An RSI above 70 suggests overbought conditions, indicating a possible downtrend. - An RSI below 30 indicates oversold conditions, suggesting a potential uptrend.
Bollinger Bands. - These bands measure volatility and price levels. - If the price touches the upper band, it may indicate an overbought condition. - If the price touches the lower band, it may indicate an oversold condition.
MACD (Moving Average Convergence Divergence). - MACD identifies changes in momentum and trends. - A bullish signal occurs when the MACD line crosses above the signal line. - A bearish signal occurs when the MACD line crosses below the signal line.
Analyzing market trends
Candlestick patterns give more clues than you think when you go beyond the basics. Here’s how to spot hidden market trends that many traders don’t notice.
Wicks reveal hidden battles. A long wick on both sides of a candle isn’t just indecision — it means big buyers and sellers are fighting for control. If these wicks keep appearing near a resistance level, it shows big players are offloading their positions while retail traders are still buying.
Gap rejections show smart money. When the market gaps up but quickly falls back, it’s not just a fake breakout. Big players create these gaps to bait small traders before pushing the price down. Watch for these gaps on lower volume—they are usually traps.
Three-candle sequences matter more. Instead of looking at a single pattern, analyze the last three candles together. If a bullish candle follows two weak, slow-selling candles, it means sellers are giving up before buyers even step in.
Trendlines lie if you don’t adjust. Static trendlines fail when volatility spikes. Instead of relying on straight lines, adjust them based on recent wick extremes. This gives a clearer picture of where real liquidity is sitting and keeps you from falling for fake breakouts.
Time frame selection
Picking a time frame changes how you trade. It affects what you see on the chart and how you react. Here’s how to use time frames smartly.
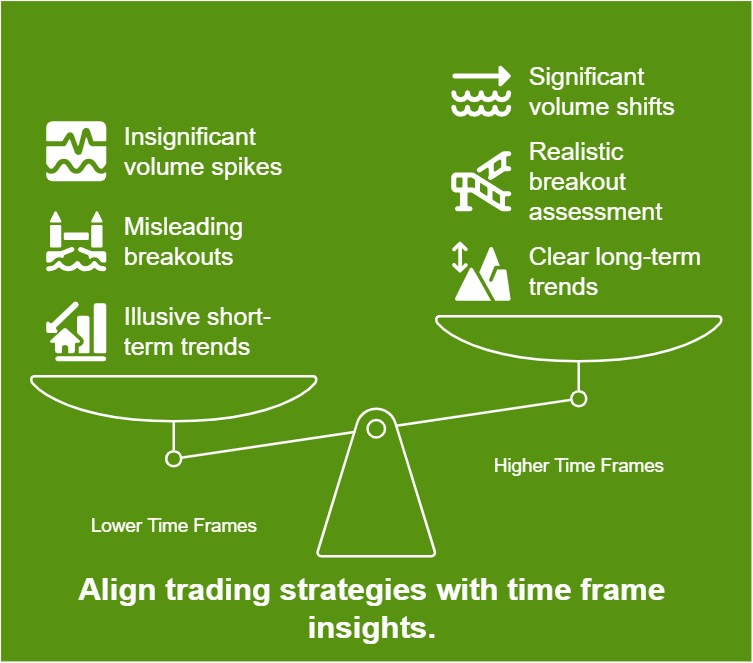
Lower time frames create illusions. A five-minute chart can make trends look explosive, but zooming out often shows a choppy market. Look at a bigger time frame to see if the trend is real or just short-term noise.
Higher time frames expose hidden traps. A breakout on a 15-minute chart might seem strong, but if it hits resistance on a daily chart, it’s likely to fail. Always check the bigger picture before jumping in.
Time frame alignment matters. If a one-hour chart shows a bullish trend, but the four-hour is bearish, you’re likely trading against the bigger flow. Trade with the dominant trend to avoid unnecessary losses.
Volume shifts across time frames. A sudden spike in volume on a five-minute chart means little if the higher time frame remains flat. Big money moves on larger time frames, so follow the action there.
For effective binary trading, we also recommend choosing a trusted broker. We suggest you familiarize yourself with the comparison table and find out the conditions of the best ones:
| Demo | Copy trading | Min. deposit | Min. trade size | Min. Payout (%) | Max. Payout (%) | Regulation | TU overall score | Open an account | |
|---|---|---|---|---|---|---|---|---|---|
| Yes | No | 5 | 1 | 17 | 95 | No | 8.7 | Open an account Your capital is at risk. |
|
| Yes | Yes | 100 | 0.01 | 70 | 95 | No | 6.83 | Open an account Your capital is at risk. |
|
| Yes | Yes | 250 | 0.01 | 70 | 95 | No | 5.52 | Open an account Your capital is at risk. |
|
| Yes | No | 250 | 1 | No | 100 | No | 4.12 | Study review | |
| Yes | Yes | 5 | 1 | 50 | 128 | MISA | 9.4 | Open an account Your capital is at risk. |
Why trust us
We at Traders Union have analyzed binary options brokers for over 14 years, evaluating them based on 40+ objective criteria. Our expert team of 50+ professionals regularly updates a Watch List of 25+ brokers, assessing key factors such as payout rates, trade types, deposit and withdrawal conditions, and platform features. We focus on trading conditions and available trading instruments to empower traders to make informed choices. Before selecting a broker, we encourage traders to review its trading conditions, supported assets, and withdrawal policies. Remember that binary options brokers are unregulated in most countries, which carries additional risks. Always conduct independent research and verify terms directly with the broker.
Learn more about our methodology and editorial policies.
Risk management and strategy development
Most traders think risk management is just about stop losses, but the hardest part is controlling emotions and tweaking strategies as the market changes. Take your risk game to the next level with these insights.
Use dynamic position sizing. Instead of risking a fixed percentage, adjust your position size based on volatility. When markets are slow, you can risk more, but when they’re wild, keep positions small.
Think in risk units. Instead of measuring trades in dollars or percentages, use a fixed risk unit (like 1R) across all trades. This keeps losses steady and makes reviewing trades easier without second-guessing.
Trap liquidity, don’t follow it. Most traders chase momentum, but smart traders look for areas where stop losses pile up. That’s where big players set traps before flipping the price.
Backtest failure, not success. Instead of only backtesting winning strategies, analyze losing trades to spot patterns in mistakes. If a strategy holds up against losing trades, it’s way stronger than one built on cherry-picked wins.
Big traders set traps using liquidity zones and session timing

Most traders focus too much on the last candlestick when predicting the next one, but what really matters is how liquidity zones and price traps come into play. Big players don’t just follow patterns — they set up traps. If a candlestick forms a long wick near a key level but doesn’t close above or below it, that’s not just indecision — it means big traders are collecting orders from retail traders. The next candle often moves in the opposite direction, catching breakout traders off guard. Instead of reacting to a pattern, watch for fake moves that trick traders into bad positions.
Another overlooked factor is candle timing and session influence. A strong bullish candle at the start of a session means something completely different from one appearing near the close. Big players push prices up early to attract traders, only to flip direction later. If the last candle closed near a high but the next session opens lower, it means buyers are trapped — expect a fast reversal. Instead of treating every candlestick the same, tie candlestick moves to market sessions and trader positioning for better predictions.
Conclusion
Predicting binary option candle direction requires a combination of candlestick analysis, technical indicators, and market trend evaluation. By mastering these elements and applying disciplined risk management, traders can enhance their accuracy and increase their chances of success in binary options trading. Remember, consistent learning and practice are essential for improving trading skills and developing a profitable strategy.
FAQs
What is the best time frame for predicting binary option candle direction?
The best time frame depends on your trading style. Short-term traders prefer 1-5 minute charts, while long-term traders use 15-minute to hourly charts for trend confirmation.
How reliable are candlestick patterns in binary options trading?
Candlestick patterns are highly reliable when used in conjunction with technical indicators and market trend analysis.
Can I trade binary options without using technical indicators?
While it’s possible, using technical indicators increases accuracy and reduces reliance on guesswork.
How can I improve my binary options win rate?
Improving your win rate requires a combination of technical analysis, market trend evaluation, and strict risk management. Practicing on a demo account before trading with real funds also helps.
Related Articles
Team that worked on the article
Oleg Tkachenko is an economic analyst and risk manager having more than 14 years of experience in working with systemically important banks, investment companies, and analytical platforms. He has been a Traders Union analyst since 2018. His primary specialties are analysis and prediction of price tendencies in the Forex, stock, commodity, and cryptocurrency markets, as well as the development of trading strategies and individual risk management systems. He also analyzes nonstandard investing markets and studies trading psychology.
Also, Oleg became a member of the National Union of Journalists of Ukraine (membership card No. 4575, international certificate UKR4494).
Chinmay Soni is a financial analyst with more than 5 years of experience in working with stocks, Forex, derivatives, and other assets. As a founder of a boutique research firm and an active researcher, he covers various industries and fields, providing insights backed by statistical data. He is also an educator in the field of finance and technology.
As an author for Traders Union, he contributes his deep analytical insights on various topics, taking into account various aspects.
Mirjan Hipolito is a journalist and news editor at Traders Union. She is an expert crypto writer with five years of experience in the financial markets. Her specialties are daily market news, price predictions, and Initial Coin Offerings (ICO).
Volatility refers to the degree of variation or fluctuation in the price or value of a financial asset, such as stocks, bonds, or cryptocurrencies, over a period of time. Higher volatility indicates that an asset's price is experiencing more significant and rapid price swings, while lower volatility suggests relatively stable and gradual price movements.
Cryptocurrency is a type of digital or virtual currency that relies on cryptography for security. Unlike traditional currencies issued by governments (fiat currencies), cryptocurrencies operate on decentralized networks, typically based on blockchain technology.
Binary options trading is a financial trading method where traders speculate on the price movement of various assets, such as stocks, currencies, or commodities, by predicting whether the price will rise or fall within a specified time frame, often as short as a few minutes. Unlike traditional trading, binary options have only two possible outcomes: a fixed payout if the trader's prediction is correct or a loss of the invested amount if the prediction is wrong.
Options trading is a financial derivative strategy that involves the buying and selling of options contracts, which give traders the right (but not the obligation) to buy or sell an underlying asset at a specified price, known as the strike price, before or on a predetermined expiration date. There are two main types of options: call options, which allow the holder to buy the underlying asset, and put options, which allow the holder to sell the underlying asset.
Backtesting is the process of testing a trading strategy on historical data. It allows you to evaluate the strategy's performance in the past and identify its potential risks and benefits.


-
 Afghanistan
-
 Albania
-
 Algeria
-
 Argentina
-
 Armenia
-
 Australia
-
 Austria
-
 Azerbaijan
-
 Bahamas
-
 Bahrain
-
 Bangladesh
-
 Belgium
-
 Botswana
-
 Brazil
-
 Brunei
-
 Bulgaria
-
 Burma
Burma
-
 Cambodia
-
 Cameroon
-
 Canada
-
 Chile
Chile
-
 China
China
-
 Colombia
-
 Costa Rica
-
 Cote d'Ivoire
-
 Croatia
-
 Cyprus
-
 Czech Republic
-
 Denmark
-
 Dominican Republic
-
 Ecuador
-
 Egypt
Egypt
-
 Estonia
-
 Eswatini
-
 Ethiopia
-
 Finland
-
 France
-
 Georgia
-
 Germany
-
 Ghana
Ghana
-
 Greece
-
 Haiti
Haiti
-
 Hong Kong
-
 Hungary
-
 India
India
-
 Indonesia
-
 Iran, Islamic republic
-
 Iraq
Iraq
-
 Ireland
-
 Israel
-
 Italy
Italy
-
 Jamaica
-
 Japan
Japan
-
 Jordan
-
 Kazakhstan
-
 Kenya
Kenya
-
 Korea
Korea
-
 Kuwait
-
 Kyrgyzstan
-
 Laos
Laos
-
 Latvia
-
 Lebanon
-
 Libyan Arab Jamahiriya
-
 Lithuania
-
 Luxembourg
-
 Macedonia
-
 Madagascar
-
 Malaysia
-
 Malta
Malta
-
 Mauritius
-
 Mexico
-
 Moldova
-
 Mongolia
-
 Montenegro
-
 Morocco
-
 Mozambique
-
 Namibia
-
 Nepal
Nepal
-
 Netherlands
-
 Nigeria
-
 Norway
-
 Oman
Oman
-
 Pakistan
-
 Palestine
-
 Papua New Guinea
-
 Peru
Peru
-
 Philippines
-
 Poland
-
 Portugal
-
 Puerto Rico
-
 Qatar
Qatar
-
 Romania
-
 Rwanda
-
 Saudi Arabia
-
 Serbia
-
 Singapore
-
 Slovakia
-
 Slovenia
-
 Somalia
-
 South Africa
-
 Spain
Spain
-
 Sri Lanka
-
 Sweden
-
 Switzerland
-
 Syrian Arab Republic
-
 Taiwan
-
 Tajikistan
-
 Tanzania, United Republic Of
-
 Thailand
-
 Trinidad and Tobago
-
 Tunisia
-
 Turkey
-
 UAE
UAE
-
 Uganda
-
 Ukraine
-
 United Kingdom
-
United States
-
 Uzbekistan
-
 Venezuela
-
 Vietnam
-
 Yemen
Yemen
-
 Zambia
-
 Zimbabwe
- Forex
- Crypto
