How To Use Candlestick Chart To Trade Binary Options


Editorial Note: While we adhere to strict Editorial Integrity, this post may contain references to products from our partners. Here's an explanation for How We Make Money. None of the data and information on this webpage constitutes investment advice according to our Disclaimer.
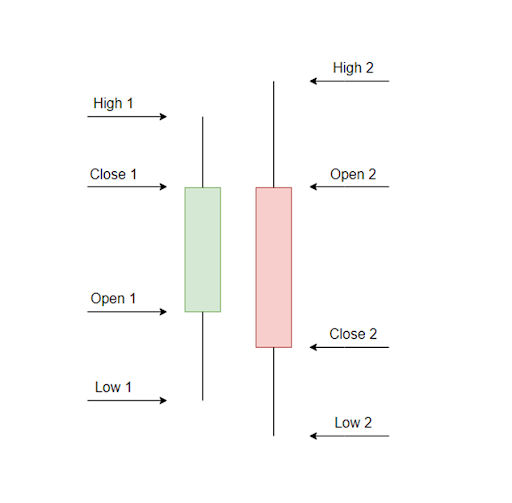
Candlestick charts are used in binary options trading to visualize asset price movements, showing open, close, high, and low values within a specific timeframe.
Candlestick analysis offers traders a visual representation of market sentiment, enabling them to make informed predictions about future price movements. In this comprehensive guide, the experts at TU delve into the intricate world of utilizing candlestick patterns to trade binary options successfully.
Introduction
What are binary options and candlestick patterns?
Binary options simplify financial trading by offering a binary choice: either a fixed amount of a specific asset or nothing at all. The essence lies in predicting whether an asset's price will surpass a predetermined level at a specified time. Candlestick patterns are visual representation of price movements in financial markets, play a pivotal role. These patterns tell crucial information within a single bar, providing traders with a condensed yet comprehensive view of market dynamics.
Binary options, as financial derivatives, have gained popularity for their straightforward nature. Traders engage in a yes/no proposition related to the future price movement of an asset. If their prediction is correct, a fixed payout is received; otherwise, the trader faces a loss. This simplicity makes binary options accessible to both novice and experienced traders.
On the other hand, candlestick patterns serve as a graphical method to portray price movements. Each candlestick represents a specific time frame, summarizing the open, close, high, and low prices. The patterns formed by these candlesticks convey vital information about market psychology and potential future price movements. Traders use candlestick analysis as a key component of their technical analysis toolkit.
 Binary options and candlestick patterns
The importance of candlestick patterns in binary options trading
Understanding candlestick patterns is foundational for effective binary options trading. Beyond their visual appeal, candlestick patterns provide critical insights into market direction and sentiment. This information is particularly valuable for binary options traders, as it aids in identifying trends and potential reversals.
Candlestick patterns offer several benefits to binary traders. Firstly, they assist in recognizing trends, whether bullish or bearish, enabling traders to align their strategies accordingly. Secondly, these patterns aid in making informed decisions by providing a snapshot of market sentiments. By interpreting the patterns, traders can gauge the prevailing mood of the market, informing their trading choices.
Moreover, candlestick patterns are instrumental in identifying potential reversals in market trends. Recognizing reversal patterns can be crucial for binary options traders aiming to enter or exit positions at opportune moments. This predictive aspect of candlestick patterns contributes significantly to the accuracy of trading decisions.
Why learn about candlestick patterns?
Learning about candlestick patterns is not just advisable; it is essential for anyone venturing into binary options trading. Candlestick patterns lay the groundwork for technical analysis and the development of winning binary options strategies. Traders who grasp these patterns gain a unique advantage, as they can visualize asset price movements, interpret market sentiments, and execute well-informed trading decisions.
In addition to aiding decision-making, understanding candlestick patterns helps traders identify potential entry and exit points in the market. The patterns serve as visual cues, guiding traders to make timely moves that align with the prevailing market conditions. This ability to pinpoint strategic entry and exit points enhances the overall success and accuracy of binary options trading strategies.
As you begin learning how to read candlestick patterns, the next logical step is applying this knowledge in a real trading environment. The platform you choose plays a crucial role, as execution speed, chart quality, and available tools can directly impact how effectively you interpret and act on candlestick signals.
Below is a comparison of some of the best binary options brokers that offer user-friendly platforms, reliable charting tools, and suitable conditions for practicing candlestick-based strategies.
| CloseOption | Capitalcore | Nadex | Pocket Option | QUOTEX | Binarium | |
|---|---|---|---|---|---|---|
|
Foundation year |
2013 | 2019 | 2009 | 2017 | 2019 | 2012 |
|
Min. deposit |
5 | 10 | 250 | 5 | 10 | 5 |
|
Min. trade size |
1 | 1 | 1 | 1 | 1 | 1 |
|
Min. Payout (%) |
17 | 60 | No | 50 | 20 | 80 |
|
Max. Payout (%) |
95 | 90 | 100 | 128 | 98 | 95 |
|
Bots or copy trading |
No | No | No | Yes | No | Yes |
|
Open an account |
Go to broker Your capital is at risk. |
Go to broker Your capital is at risk.
|
Study review | Go to broker Your capital is at risk. |
Go to broker Your capital is at risk. |
Go to broker Your capital is at risk. |
Understanding candlestick patterns
What are candlestick patterns?
Candlestick patterns provide traders with a visual representation of price movements within financial markets. This graphical tool condenses vital information into a single bar, offering insights into opening, closing, high, and low prices over a specific time period, be it a day or an hour. The patterns on the candlestick chart serve as a language of market dynamics, allowing traders to decipher the story unfolding in the price movements.
Types of candlestick patterns
Candlestick patterns are broadly classified into three categories, each conveying distinct market sentiments.
Bullish candlestick patterns
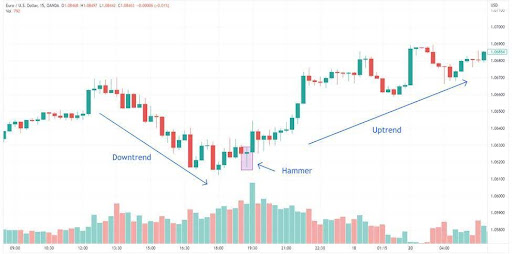
When bullish patterns emerge, they signal an inclination for the asset's price to ascend. Notable examples include the hammer, bullish engulfing pattern, and morning star. The hammer, for instance, indicates a potential reversal in a downtrend, with buyers stepping in to drive prices higher.
 Bullish candlestick patterns
Bearish candlestick patterns
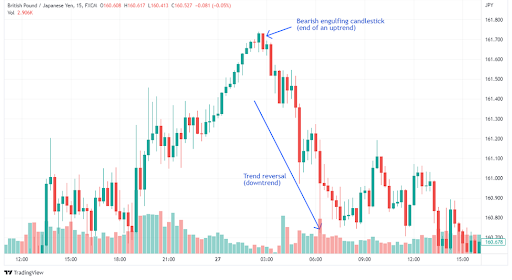
Conversely, bearish patterns suggest an anticipated decline in the asset's price. Recognizable patterns in this category encompass the shooting star, bearish engulfing pattern, and evening star. The shooting star, for instance, warns of a potential reversal in an uptrend, as sellers gain control and drive prices lower.
 Bearish candlestick patterns
Neutral candlestick patterns
Neutral patterns, such as the doji and spinning top, convey market indecision. In these scenarios, the forces of buying and selling are in equilibrium, and the market could sway in either direction. The doji, with its open and close prices nearly equal, illustrates the tug of war between buyers and sellers.
 Neutral candlestick patterns
The psychology behind candlestick patterns
At the heart of candlestick patterns lies the psychology of market participants. These patterns act as visual representations of traders' and investors' emotions, such as fear, greed, and uncertainty. Understanding the psychology behind these patterns enhances a trader's ability to interpret market dynamics effectively.
Consider the hammer, a bullish pattern with its small body and long lower wick, signals potential bullish momentum after a downtrend. It reflects a scenario where, despite downward pressure, buyers regain control, pushing prices back up. This showcases a shift in sentiment from bearish to bullish.
Conversely, the shooting star, a bearish pattern, indicates a reversal in an uptrend. It represents a struggle between buyers and sellers, with sellers gaining dominance and pushing prices down, signaling a potential trend reversal.
Furhermore, a doji, characterized by its small body is a candlestick pattern that indicates market indecision, suggesting a potential reversal.
There are also engulfing patterns, whether bullish or bearish, signify a shift in market sentiment.
Analyzing these patterns allows traders to gauge the prevailing sentiments in the market, empowering them to make informed decisions. Also, discover the best Heikin Ashi binary options strategy, designed to provide smoother trends, smarter entry points, and more consistent trading results.
Identifying candlestick patterns in binary options charts
How to identify candlestick patterns on binary options charts?
The process of identifying candlesticks begins with a comprehensive understanding of various patterns, each conveying unique insights into market sentiment and potential future price movements. Key patterns to grasp include the doji, hammer, engulfing patterns, and more. These patterns manifest in distinctive shapes on charts, each telling a story about the battle between buyers and sellers during a specific time period.
As a trader, meticulous observation and continuous learning are essential. Studying historical charts and real-time market data helps refine your ability to recognize these patterns accurately.
The importance of accurate pattern recognition
Accurate pattern recognition serves as the cornerstone of successful binary options trading. Recognizing these patterns accurately enables traders to align their strategies with the prevailing market dynamics. For instance, identifying bullish patterns can guide traders to opportune entry points for call options, anticipating upward price trends. On the flip side, recognizing bearish patterns facilitates the identification of suitable entry points for put options, anticipating downward price movements.
Accurate pattern recognition empowers traders to make well-timed and informed decisions, enhancing the overall profitability of their trading endeavors. Through a deep understanding of candlestick patterns, traders can decode the language of the market, gaining a competitive edge in predicting price movements.
Distinguishing between genuine candlestick patterns and false signals
The ability to distinguish between genuine candlestick patterns and false signals is a crucial skill that sets seasoned traders apart. False signals can lead to misguided decisions and financial losses. To effectively filter out false signals, traders must consider the broader context in which a pattern forms. Genuine patterns often align with prevailing trends or indicate potential reversals, providing a coherent narrative in the market's broader story. In contrast, false signals may lack supporting market context, appearing randomly without clear justification.
Verifying candlestick patterns across multiple timeframes is a strategic approach to confirming their authenticity. A pattern that holds true across various timeframes strengthens its validity and increases a trader's confidence in its predictive power. Rigorous analysis, coupled with an in-depth understanding of market dynamics, enables traders to sift through noise and identify patterns that are more likely to result in profitable trades.
Using technical indicators to confirm candlestick patterns
While candlestick patterns offer valuable insights, integrating technical indicators into the analysis process provides a more comprehensive understanding of market conditions. Technical indicators, such as Moving Averages, Relative Strength Index (RSI), Moving Average Convergence Divergence (MACD), and Bollinger Bands, serve as complementary tools to confirm or challenge the indications provided by candlestick patterns.
For example, if a bullish candlestick pattern emerges and is substantiated by an uptrend on the Moving Average, it adds a layer of confirmation to the potential upward movement. Similarly, if a bearish pattern aligns with an overbought condition on the RSI, it enhances the likelihood of a forthcoming price decline. Utilizing technical indicators in conjunction with candlestick patterns forms a robust analytical approach, mitigating the risk of relying solely on visual patterns.
Utilizing candlestick patterns for binary options trading strategies
Binary options trading strategies based on candlestick patterns provide traders with a systematic approach to navigating the financial markets. These strategies are designed to capitalize on specific candlestick patterns, offering clear entry and exit points. Integrating risk management techniques further enhances the effectiveness of these strategies.
Strategy 1 – Engulfing candle pattern strategy
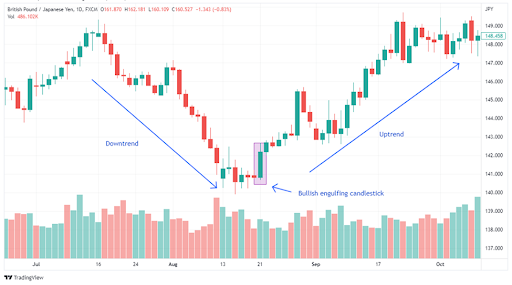
The Engulfing Candle Pattern Strategy focuses on identifying trend reversal points. Traders using this strategy look for bullish or bearish engulfing patterns, where the body of one candle completely engulfs the previous candle. An entry point occurs at the opening of the next candle after the engulfing pattern. For a bullish engulfing pattern, a trader enters a long position, anticipating an upward price movement. Conversely, for a bearish engulfing pattern, a trader enters a short position, expecting a downward price movement.
Risk management for the engulfing candle pattern strategy involves setting a stop-loss order below the low of the engulfing pattern candle. This limits potential losses if the trade goes against the anticipated reversal. Take-profit levels are determined based on predetermined profit targets or if subsequent candles suggest a potential reversal.
 Engulfing candle pattern strategy
Strategy 2 – Piercing line candle pattern strategy
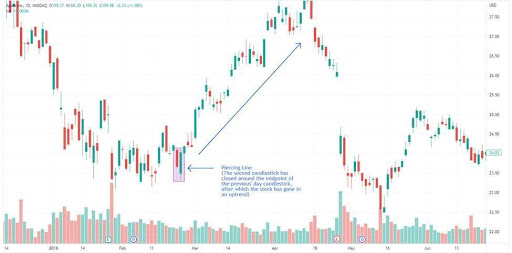
The Piercing Line Candle Pattern Strategy aims to identify potential bullish reversals after a downtrend. Traders using this strategy look for the piercing line pattern, where a bullish candle closes above the midpoint of the previous bearish candle. An entry point occurs at the opening of the next candle after the piercing line pattern. Traders enter a long position, expecting an upward price movement.
Risk management for the piercing line candle pattern strategy involves setting a stop-loss order below the low of the piercing line pattern candle. This helps limit potential losses if the trade does not unfold as anticipated. Take-profit levels are established based on predetermined profit targets or if subsequent candles suggest a potential reversal.
 Piercing line candle pattern strategy
Strategy 3 – Evening star candle pattern strategy
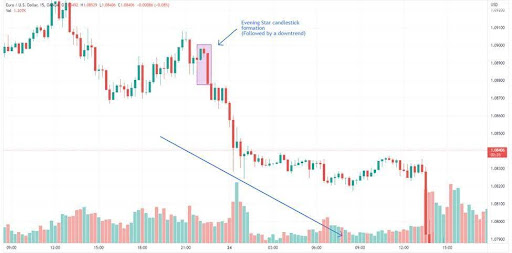
The Evening Star Candle Pattern Strategy is a bearish reversal strategy. Traders identify the evening star pattern, characterized by a bullish candle, a small indecisive candle, and a bearish candle. An entry point occurs at the opening of the candle following the evening star pattern. Traders enter a short position, anticipating a downward price movement.
Risk management for the evening star candle pattern strategy includes setting a stop-loss order above the high of the evening star pattern candle. This helps limit potential losses if the trade moves against the expected reversal. Take-profit levels are determined based on predetermined profit targets or if subsequent candles suggest a potential reversal.
 Evening star candle pattern strategy
Strategy 4 – Morning Star Candle Pattern Strategy
Conversely, the Morning Star Candle Pattern Strategy is a bullish reversal strategy. Traders using this strategy identify the morning star pattern, consisting of a bearish candle, a small indecisive candle, and a bullish candle. An entry point occurs at the opening of the candle following the morning star pattern. Traders enter a long position, expecting an upward price movement.
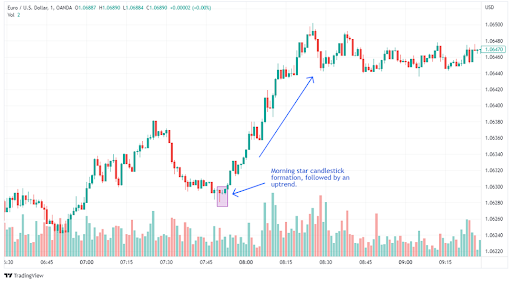 Morning Star Candle Pattern Strategy
Risk management for the Morning Star Candle Pattern Strategy involves setting a stop-loss order below the low of the morning star pattern candle. This helps limit potential losses if the trade moves against the expected reversal. Take-profit levels are established based on predetermined profit targets or if subsequent candles suggest a potential reversal.
| Candlestick pattern | Significance | Strategies |
|---|---|---|
| Engulfing candle | Reversal signal for potential trend change. | Enter trades in the direction of the reversal. |
| Piercing line candle | Bullish reversal after a downtrend. | Consider long positions for potential reversal. |
| Evening star candle | Bearish reversal at the end of an uptrend. | Consider short positions for potential reversal. |
| Morning star candle | Bullish reversal at the end of a downtrend. | Consider long positions for potential reversal. |
Advanced candlestick pattern techniques
Advanced candlestick pattern techniques
Candlestick patterns offer a rich tapestry of insights for traders, and advanced techniques go beyond individual patterns to explore combinations, formations, and synergies with technical indicators. Mastering these advanced approaches enhances a trader's ability to interpret market dynamics and make more informed decisions.
Multiple candlestick patterns
Understanding the dynamics of multiple candlestick patterns provides a nuanced view of market sentiment. Combinations like the Three White Soldiers, where three consecutive bullish candles signal a strong uptrend, or the Three Black Crows, indicating a robust downtrend, offer comprehensive insights into sustained market movements. Recognizing these patterns involves a holistic assessment of consecutive candles, considering their sizes, positions, and relationships.
Candlestick formations
Candlestick formations extend beyond individual patterns to capture the broader market context. Patterns like the Rising Three Methods or Falling Three Methods involve a mix of trending and consolidating candles, offering a more intricate analysis of market behavior. Traders decipher these formations to identify potential trend continuation or reversal, allowing for more sophisticated trading strategies.
Candlestick patterns in conjunction with technical indicators
Integrating candlestick patterns with technical indicators creates a powerful synergy. For example, combining the Moving Average Convergence Divergence (MACD) indicator with candlestick patterns enhances trend analysis. If a bullish engulfing pattern coincides with a bullish MACD crossover, it strengthens the buy signal. This convergence of different analytical tools provides a more robust foundation for decision-making.
Candlestick pattern confirmation
Confirmation is a critical aspect of trading with candlestick patterns. While these patterns offer valuable signals, confirming their validity with additional factors is prudent. Traders often look for volume confirmation, where a substantial increase in trading volume accompanies a significant price move indicated by a candlestick pattern. This volume confirmation adds conviction to the trade signal, reducing the likelihood of false alarms.
Continuous learning and market analysis
The realm of candlestick patterns is dynamic, and continuous learning is essential for staying ahead of market changes. Regularly updating one's knowledge of emerging patterns, understanding their historical reliability, and adapting to evolving market conditions is paramount. Traders should engage in ongoing market analysis, staying informed about economic events, geopolitical developments, and broader market trends. This continuous learning process is the cornerstone of sustained success in utilizing candlestick patterns effectively.
Pros and cons of using candlesticks
- Pros
- Cons
- Clear visualization
Candlesticks offer traders a visual representation of price movements in a single bar. This clarity facilitates a detailed view of market direction and sentiment, aiding in the interpretation and analysis of price shifts. - Informative insights
These patterns provide a wealth of information at a glance, enabling traders to read charts effectively. Candlesticks offer insights into market sentiment, potential reversals, and trend continuations, empowering traders to make well-informed decisions. - Short-term predictions
Simple candlestick formations are valuable for binary options traders seeking short-term trading opportunities. The patterns formed allow for quick predictions, facilitating prompt decision-making in the dynamic market environment. - Superiority to traditional charts
Candlestick charts surpass traditional charts by offering a more detailed and informative perspective on price movements. They provide a nuanced understanding of the psychological factors influencing currency trades, such as greed, fear, and hope, leading to more informed trading decisions.
- False signals
A notable disadvantage of using candlesticks is the potential for false signals. Market volatility and noise can sometimes lead to misinterpretations of candlestick patterns, resulting in trading errors and financial losses. - Unpredictability and risk management
Candlestick patterns may appear differently across various timeframes, introducing an element of unpredictability. This variability can make it challenging for traders to trust the message conveyed by a candlestick pattern, particularly when utilizing multiple timeframes. This uncertainty may lead to hesitation in executing trades, impacting effective risk management.
Expert Opinion

Candlestick patterns can provide valuable signals but should not be relied upon alone for making trading decisions. They only tell part of the story and capture a snapshot in time but don't show the larger market context or factors that could impact the underlying asset's movement.
The best strategy is to wait for confirmation of the reversal either through a follow-through candlestick pattern, a move in price in the anticipated direction, or confirmation from other technical analysis tools. Jumping in right away when spotting a single pattern often leads to premature trades that go against you, context matters immensely. A bullish engulfing pattern, for example, carries more weight when it appears at a strong support level or after a prolonged downtrend. Moreover, always check the larger time frame charts before trading any pattern on a lower time frame, don't fight an established daily or 4-hour trend.
My advice is to practice identifying these patterns on historical charts before risking real capital. Pay close attention to the success rate of each pattern in different market conditions. You'll likely find that some patterns work better in trending markets, while others are more reliable in ranging conditions.
Conclusion
Mastering candlestick patterns offers binary options traders a vital edge by enhancing their ability to interpret price action and anticipate market moves. By recognizing distinct formations like engulfing candles or doji patterns, traders can confidently enter positions with higher probabilities of success. Consistent application of pattern recognition, coupled with sound risk management, transforms candlestick analysis from theory into real profits. Ultimately, the discipline to follow these patterns—and the patience to wait for strong signals—can be the deciding factor between guesswork and strategic trading. Remember, the charts tell a story; it’s up to you to read it well and act decisively.
FAQs
How do candlestick patterns help identify optimal entry and exit points in binary options trading?
What role do technical indicators play when used alongside candlestick patterns in binary options trading?
Can candlestick patterns be effective for trading multiple timeframes in binary options, and how should traders approach this?
What are some advantages of using candlestick charts over traditional bar or line charts in binary options trading?
Editors' Top Picks and Insights

Global fintech in 2026: Three trends that matter

From Jesus Christ to aliens: Polymarket's most absurd prediction markets

Hunting crypto owners: Why criminals have gone offline

BitMEX is shutting down: Why Trump could not save the exchange

Do governments need crypto workers?

Brent nears $100: Why oil prices are rising
Related Articles
Team that worked on the article
Alamin Morshed is a contributor at Traders Union. He specializes in writing articles for businesses that want to improve their Google search rankings to compete with their competition.
Dan Blystone began his trading career in 1998 as an arbitrage clerk on the floor of the Chicago Mercantile Exchange (CME). He later traded bond and Eurex futures at proprietary firms such as Altea Trading, gaining valuable experience in high-frequency trading and risk management.
Chinmay Soni is a financial analyst with more than 5 years of experience in working with stocks, Forex, derivatives, and other assets. As a founder of a boutique research firm and an active researcher, he covers various industries and fields, providing insights backed by statistical data.
A long position in Forex, represents a positive outlook on the future value of a currency pair. When a trader assumes a long position, they are essentially placing a bet that the base currency in the pair will appreciate in value compared to the quote currency.
Copy trading is an investing tactic where traders replicate the trading strategies of more experienced traders, automatically mirroring their trades in their own accounts to potentially achieve similar results.
Bollinger Bands (BBands) are a technical analysis tool that consists of three lines: a middle moving average and two outer bands that are typically set at a standard deviation away from the moving average. These bands help traders visualize potential price volatility and identify overbought or oversold conditions in the market.
Risk management is a risk management model that involves controlling potential losses while maximizing profits. The main risk management tools are stop loss, take profit, calculation of position volume taking into account leverage and pip value.
An investor is an individual, who invests money in an asset with the expectation that its value would appreciate in the future. The asset can be anything, including a bond, debenture, mutual fund, equity, gold, silver, exchange-traded funds (ETFs), and real-estate property.

-
 Afghanistan
-
 Albania
-
 Algeria
-
 Angola
-
 Argentina
-
 Armenia
-
 Australia
-
 Austria
-
 Azerbaijan
-
 Bahamas
-
 Bahrain
-
 Bangladesh
-
 Belarus
-
 Belgium
-
 Bolivia
-
 Botswana
-
 Brazil
-
 Brunei
-
 Bulgaria
-
 Cambodia
-
 Cameroon
-
 Canada
-
 Chile
Chile
-
 China
China
-
 Colombia
-
 Congo
Congo
-
 Costa Rica
-
 Cote d'Ivoire
-
 Croatia
-
 Cuba
Cuba
-
 Cyprus
-
 Czechia
-
 DR Congo
-
 Denmark
-
 Dominican Republic
-
 Ecuador
-
 Egypt
Egypt
-
 El Salvador
-
 Estonia
-
 Eswatini
-
 Ethiopia
-
 Finland
-
 France
-
 Georgia
-
 Germany
-
 Ghana
Ghana
-
 Greece
-
 Haiti
Haiti
-
 Hong Kong
-
 Hungary
-
 India
India
-
 Indonesia
-
 Iran, Islamic republic
-
 Iraq
Iraq
-
 Ireland
-
 Israel
-
 Italy
Italy
-
 Jamaica
-
 Japan
Japan
-
 Jordan
-
 Kazakhstan
-
 Kenya
Kenya
-
 Korea
Korea
-
 Kuwait
-
 Kyrgyzstan
-
 Laos
Laos
-
 Latvia
-
 Lebanon
-
 Lesotho
-
 Libya
Libya
-
 Lithuania
-
 Luxembourg
-
 Madagascar
-
 Malaysia
-
 Malta
Malta
-
 Mauritius
-
 Mexico
-
 Moldova
-
 Mongolia
-
 Montenegro
-
 Morocco
-
 Mozambique
-
 Myanmar
-
 Namibia
-
 Nepal
Nepal
-
 Netherlands
-
 New Zealand
-
 Nigeria
-
 North Macedonia
-
 Norway
-
 Oman
Oman
-
 Pakistan
-
 Palestine
-
 Panama
-
 Papua New Guinea
-
 Paraguay
-
 Peru
Peru
-
 Philippines
-
 Poland
-
 Portugal
-
 Puerto Rico
-
 Qatar
Qatar
-
 Reunion
-
 Romania
-
 Rwanda
-
 Saudi Arabia
-
 Serbia
-
 Singapore
-
 Slovakia
-
 Slovenia
-
 Somalia
-
 South Africa
-
 Spain
Spain
-
 Sri Lanka
-
 Sweden
-
 Switzerland
-
 Syria
Syria
-
 Taiwan
-
 Tajikistan
-
 Tanzania
-
 Thailand
-
 Trinidad and Tobago
-
 Tunisia
-
 Turkey
-
 UAE
UAE
-
 Uganda
-
 Ukraine
-
 United Kingdom
-
United States
-
 Uruguay
-
 Uzbekistan
-
 Venezuela
-
 Vietnam
-
 Yemen
Yemen
-
 Zambia
-
 Zimbabwe
- Forex
- Crypto
