Zero To Hero: Complete binary Options Trading Guide
Essential metrics for binary options trading performance analysis:
Win rate – Proportion of successful trades out of total trades
Profit factor – Ratio of profits to loss
Return on Investment (ROI) – Metric of overall investment profitability
Average Profit/Loss per trade – Helps judge realised risk:reward ratio
Sharpe ratio – Provides risk-adjusted view into returns over and above the risk-free rate
Sortino ratio – Accounts for downside risk more effectively
Trading performance analysis is instrumental in not only identifying areas for improvement but also in fine-tuning trading strategies and contributing to the achievement of long-term goals. In this article, the experts at TU delve into the importance of trading performance analysis and its impact on success in binary options trading. They will also explore ways you can employ it for analyzing your own binary options trading performance.
Why is performance analysis crucial in binary options trading?
Performance analysis is crucial for risk assessment, strategy evaluation, informed decision-making, continuous improvement, and emotional discipline, enabling traders to enhance overall effectiveness and achieve long-term success.
What are the common mistakes to avoid in binary options performance analysis?
Common mistakes include neglecting risk management, succumbing to emotional factors, chasing losses, ignoring market conditions, lacking continuous learning, overtrading, and relying on luck. Avoiding these allows for better performance analysis and success.
What is the best analysis for binary options?
The best analysis for binary options involves a combination of fundamental and technical analysis. Fundamental analysis assesses economic indicators, news events, and company performance, while technical analysis utilizes charts, patterns, and indicators to predict price movements. Successful traders often integrate both approaches for a comprehensive understanding of market conditions.
How do you master binary options trading?
Mastering binary options trading requires a multi-faceted approach. It involves acquiring a deep understanding of financial markets, learning technical analysis and chart patterns, developing effective risk management strategies, and continuously refining one's trading plan. Additionally, gaining experience through practice, staying informed about market trends, and learning from both successes and failures contribute to mastering the complexities of binary options trading.
Introduction
To begin with, it’s import to understand why analyzing your trading performance is important, and how it can help you in your trading journey. Experts have broken this down in the following sections:
Why analyzing your trading performance is crucial for success in binary options trading?
At the core of binary options success lies the diligent analysis of one's trading performance. This tells a trader’s strengths and weaknesses, offering a clear view of what works and what doesn't. With these insights from performance analysis, traders can make well-informed decisions, honing their strategies for optimal outcomes.
How does performance analysis help identify areas for improvement and optimize trading strategies?
Performance analysis acts as an important lens, providing traders with valuable data on their trading behavior. This data includes the number of trades executed, the success rate, and the financial outcomes. By understanding this information, traders identify patterns and trends, allowing them to adapt and refine their strategies for enhanced effectiveness.
The role of performance analysis in risk management and achieving long-term trading goals
By undertaking performance analysis, traders can pinpoint areas of vulnerability and proactively mitigate risks. Furthermore, this practice helps traders to set meaningful, long-term goals, tracking their journey towards these objectives with precision and adaptability.
Essential metrics for binary options trading performance analysis
Key Performance Indicators (KPIs) serve as the compass for traders, offering insights into the effectiveness of strategies and overall success in the market. The most crucial ones for binary options traders include the following:
| KPI | Formula |
|---|---|
Win rate | (Number of Winning Trades / Total Trades) * 100 |
Profit factor | Total Profits / Total Losses |
Return on Investment (ROI) | (Net Profit / Initial Investment) * 100 |
Average Profit/Loss per trade | (Total Profits - Total Losses) / Total Trades |
Sharpe ratio | (Average Return - Risk-Free Rate) / Standard Deviation of Returns |
Sortino ratio | (Average Return - Target Return) / Downside Standard Deviation |
Win rate
The Win Rate represents the proportion of successful trades against the total number of executed trades. A higher Win Rate indicates a more successful trading strategy, reflecting the efficacy of entry and exit points.
To improve win rate:
Employ robust risk management techniques
Stay up to date with market trends
Continuously analyze losing trades to find patterns for improvement
Profit factor
The Profit factor quantifies the relationship between gains and losses. A ratio above 1 suggests profitability, emphasizing the importance of not just winning trades but ensuring the magnitude of profits surpasses losses.
To improve profit factor:
Focus on maximizing profits during winning streaks while minimizing losses during downturns
Undertake strategic position sizing
Return on Investment (ROI)
ROI gauges the profitability of the overall investment. It is a holistic KPI that considers both successful and unsuccessful trades, providing a comprehensive view of the returns generated.
To enhance ROI:
Try to strike a balance between risk and reward
Focus on risk management techniques
Try choosing trades with favorable risk-to-reward ratios
Avoiding over-leveraging
Average Profit/Loss per trade
This KPI delves into the granular details of individual trades and often complements other KPIs. Using both, the average profit and average loss per trade, traders can calculate the realised risk:reward ratio, which would help them judge their actual risk taken for each unit of profit against their original risk budget.
To improve the Average Profit/Loss per trade:
Perform a detailed analysis of trade parameters
Explore optimizing entry and exit points
Employ technical analysis
Consider macroeconomic factors influencing asset prices
Sharpe ratio
The Sharpe ratio introduces the element of risk, assessing the return generated per unit of risk taken. A higher Sharpe ratio signifies a more efficient use of risk to achieve returns.
To enhance the Sharpe ratio:
Implement risk management strategies
Adjust leverage based on market conditions
Sortino ratio
The Sortino ratio builds on the Sharpe ratio, emphasizing downside risk. It considers only the volatility associated with negative returns, providing a more targeted assessment of risk-adjusted performance.
To improve the Sortino ratio:
Focus on minimizing downside risk
Refine risk management approaches
Identify and mitigate sources of potential losses
Adopt a proactive approach to adverse market conditions
Tools and techniques for binary options trading performance analysis
Trading Journals and record-keeping
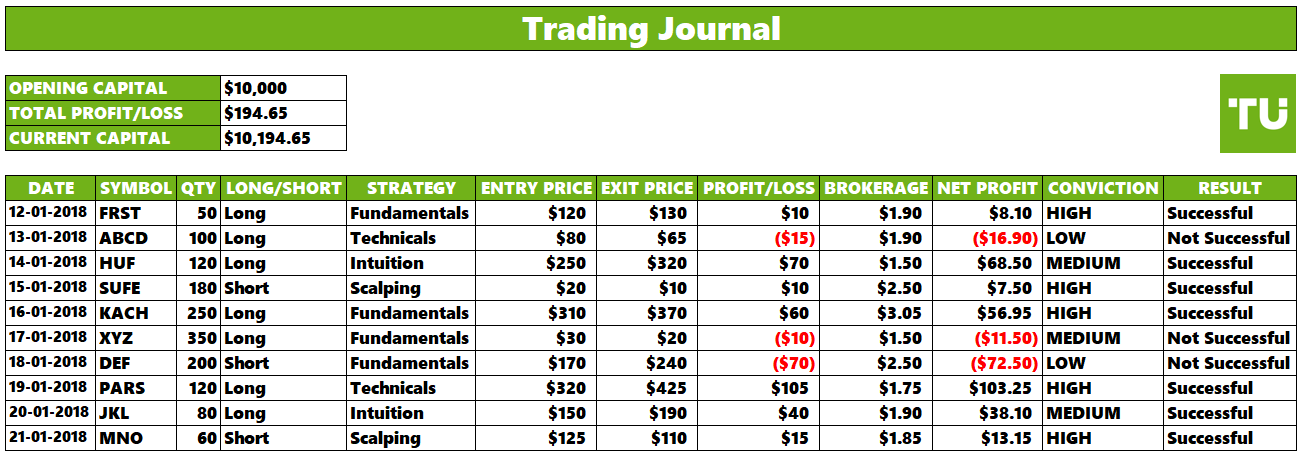
Trading Journal
Learning from experiences
Keeping a detailed trading journal is not merely an exercise; rather, it is a fundamental aspect of the learning process for binary options traders. The act of recording each trade, along with relevant details, transforms trading ianto a reflective practice. Traders can gain insights into their successes, learn from their mistakes, and continuously refine their approach.
Comprehensive self-analysis
Beyond the numbers, a trading journal captures the trader's mindset, emotions, and decision-making process during each trade. Reviewing these aspects helps traders understand the psychological factors influencing their trading and enables them to make adjustments to their behavior.
Essential elements to include in a trading journal
Trade entry and exit points
This information provides a clear picture of the timing of trades and helps identify patterns related to successful entries or exits.
Profit/loss amounts
It aids in identifying profitable strategies and areas where losses can be minimized.
Market conditions
Noting the prevailing market conditions during trade execution provides context. Market volatility, economic events, or news releases can significantly impact trade outcomes.
Rationale behind each trade
Including the rationale behind each trade allows for a deeper understanding of decision-making. It allows traders to assess whether trades were based on a well-defined strategy or influenced by emotions.
Emotional states during trading
Tracking emotional states during trading is essential for recognizing patterns of behavior influenced by fear, greed, or uncertainty. This self-awareness is critical for maintaining discipline.
External factors influencing decisions
External factors, such as external news or global events, can influence trading decisions. Documenting these factors helps in understanding the broader context of market movements.
Utilizing spreadsheets or specialized trading software
Flexibility of spreadsheets
Spreadsheets like Microsoft Excel or Google Sheets provide a flexible platform for creating customized tracking systems. Traders can design tables to input data, create formulas for performance metrics, and generate visualizations tailored to their preferences.
Advanced features of specialized software
Specialized trading software designed explicitly for performance analysis may offer advanced features such as automated data input, detailed analytics, and customizable dashboards. These tools streamline the process of reviewing and interpreting data.
Graphical analysis and charts
Employing charts to visualize trading performance trends helps in:
Quick and intuitive understanding
Charts offer a quick and intuitive understanding of trading performance trends. Visual representations of data, such as line charts, bar charts, and candlestick charts, provide an immediate overview of a trader's overall success and areas for improvement.
Identification of patterns
Visualizing performance trends through charts allows traders to identify patterns and trends. Patterns may include consistent success in specific market conditions or recurring challenges that need attention.
Understanding Line charts, Bar charts, and Candlestick charts
Line charts
Line charts offer simplicity and clarity, presenting a straightforward view of price trends over time. They are especially useful for grasping the overall trajectory of trading performance.
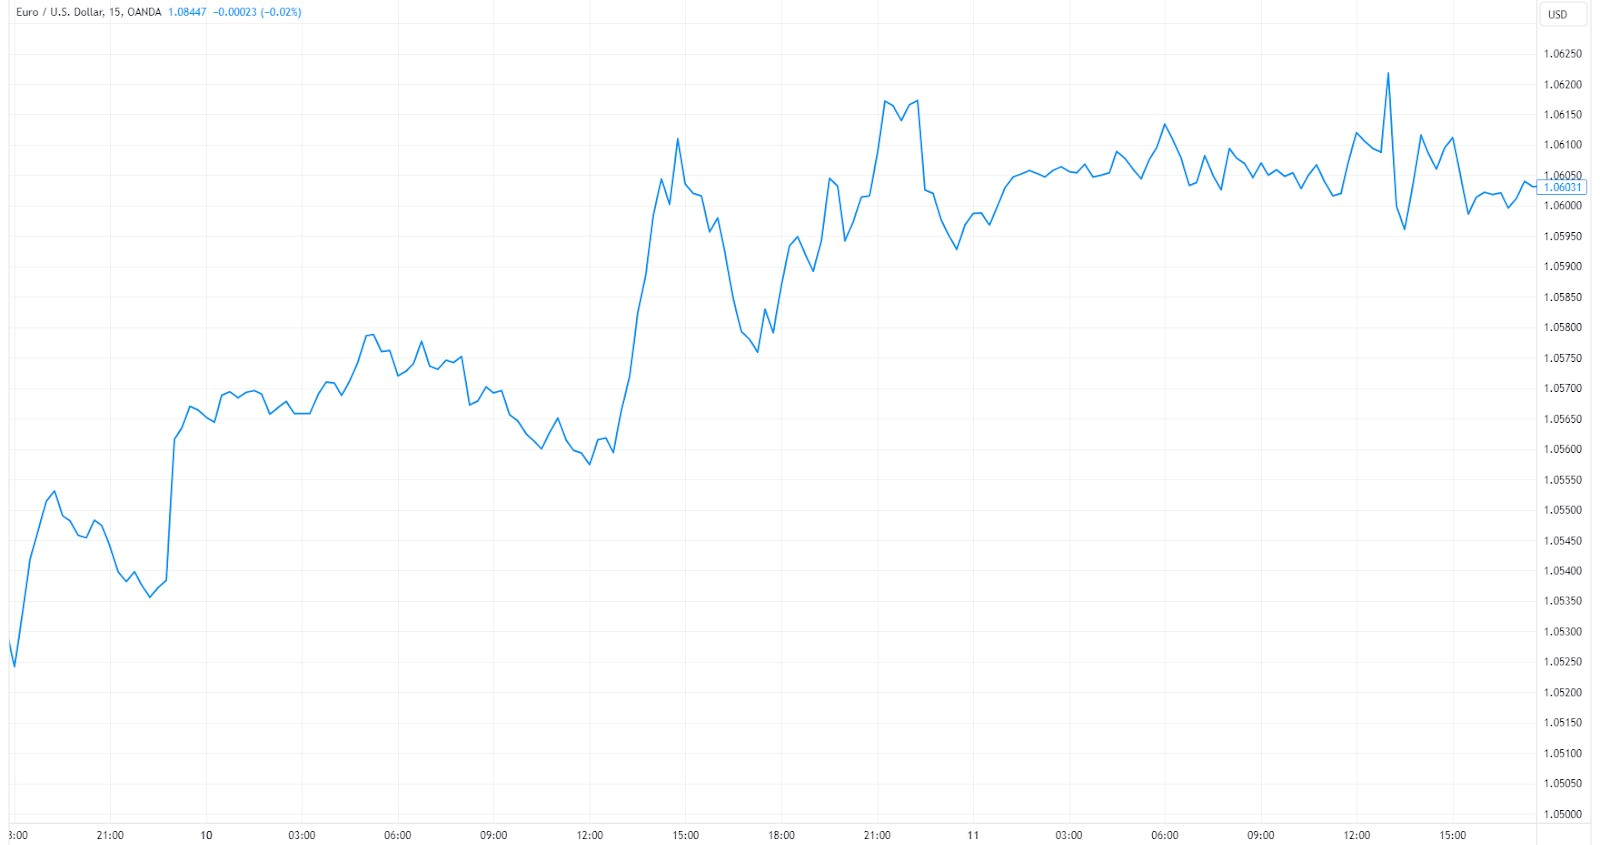
Line charts
Bar charts
Bar charts provide a more detailed representation of price movements, displaying not only opening and closing prices but also the highest and lowest points during a specific period. Using these charts, traders generally aim to derive insights into the volatility and range of market movements.
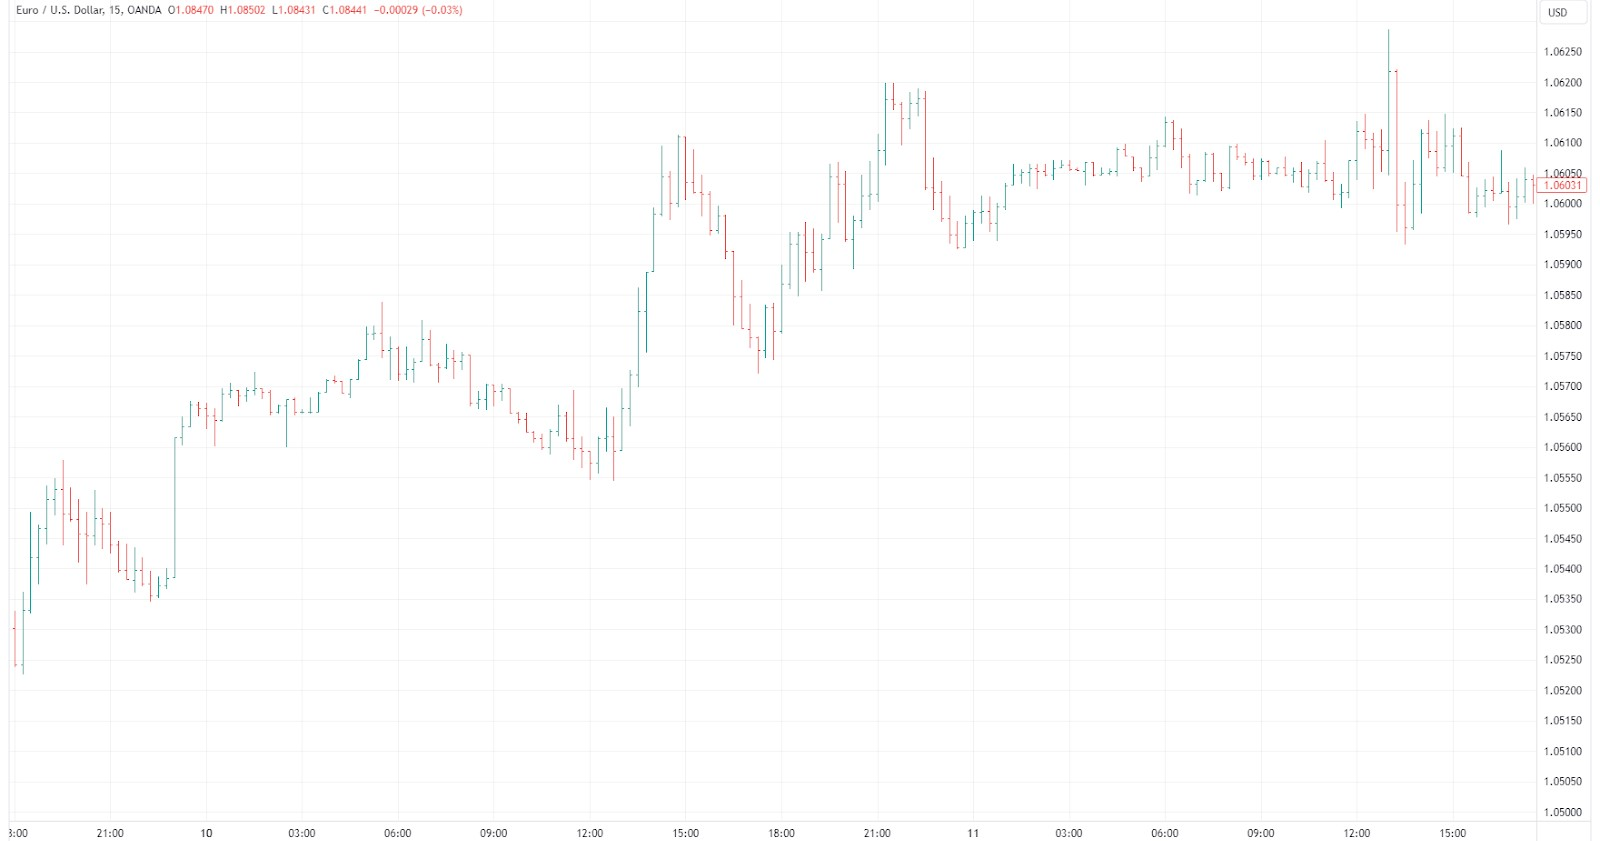
Bar charts
Candlestick charts
Candlestick charts, with their unique visual elements, offer insights into market sentiment. Patterns like dojis, hammers, or engulfing candles can signal potential reversals or the continuation of trends. Understanding these patterns enhances a trader's ability to make informed decisions. Read more in the article: How To Use Candlestick Patterns To Trade Binary Options
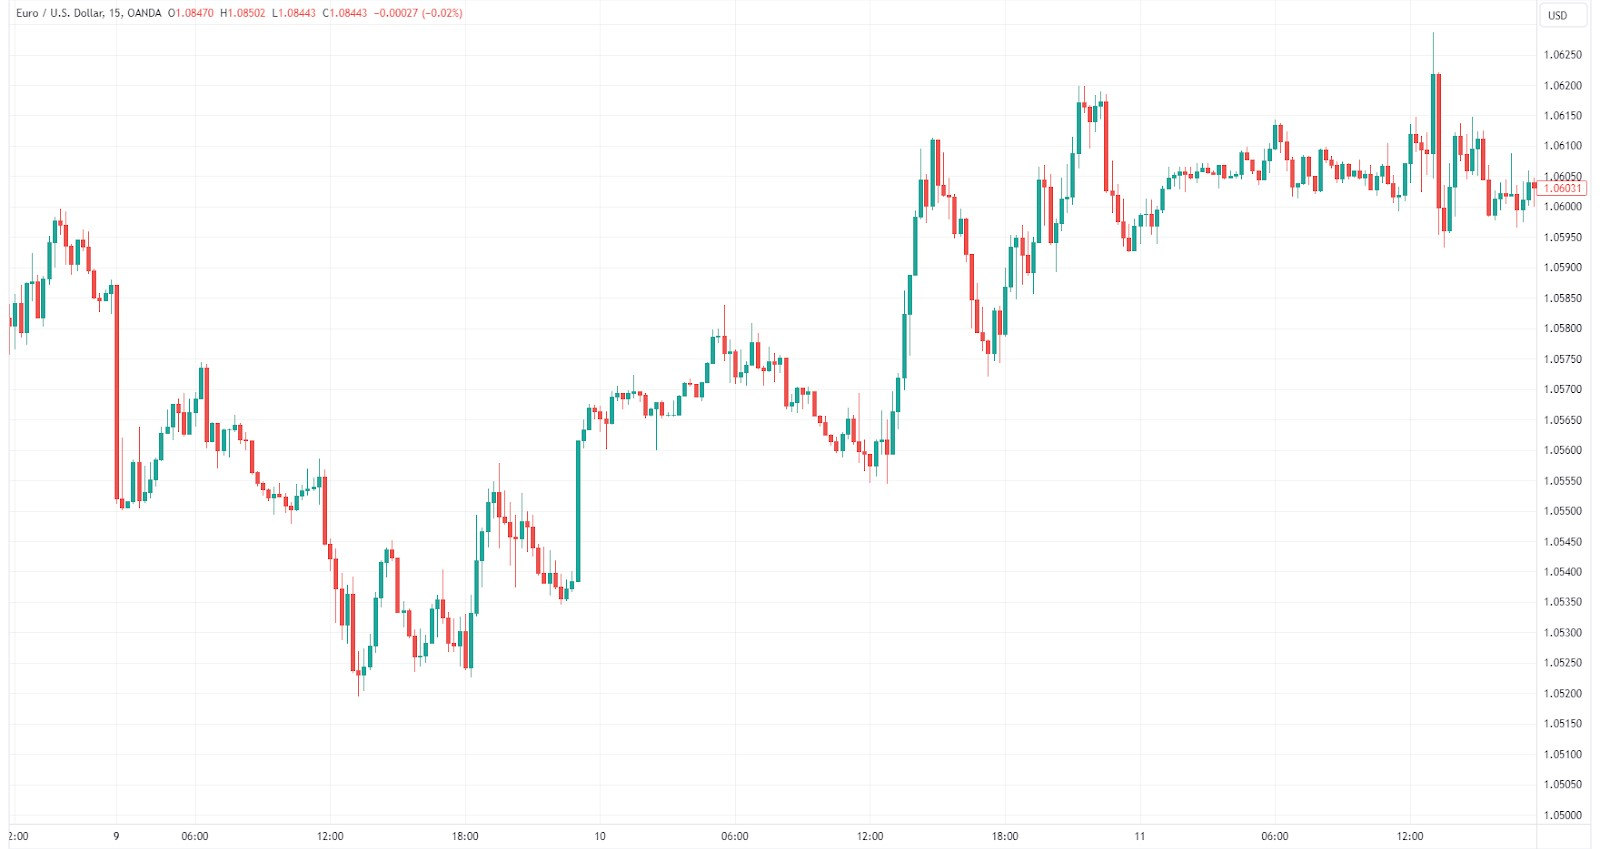
Candlestick charts
Utilizing technical indicators for enhanced analysis
Moving averages for trend identification
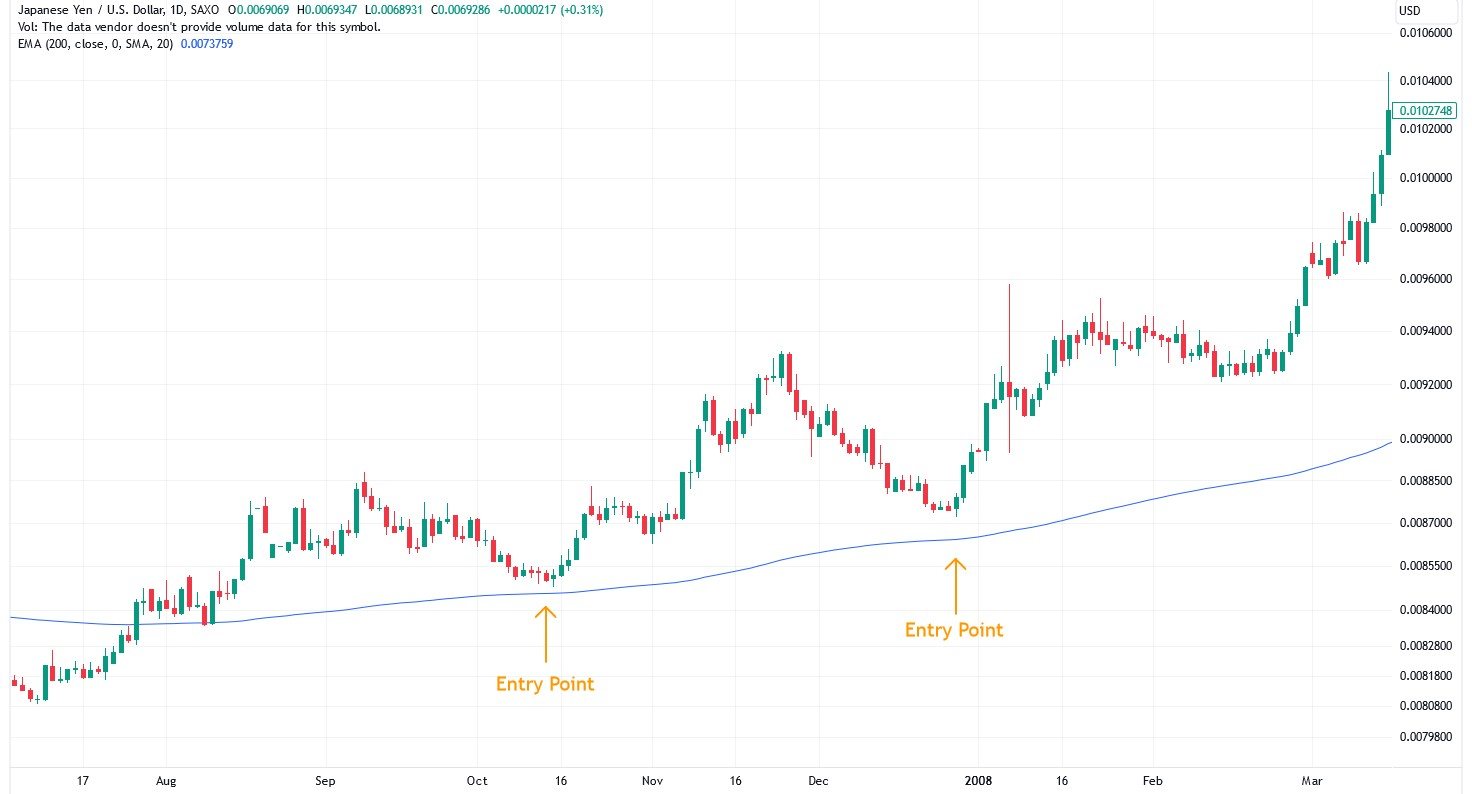
Moving averages for trend identification
Moving averages smooth out price data, aiding in the identification of underlying trends. Traders can use simple or exponential moving averages to understand the general direction of price movements.
Volatility insights from Bollinger Bands
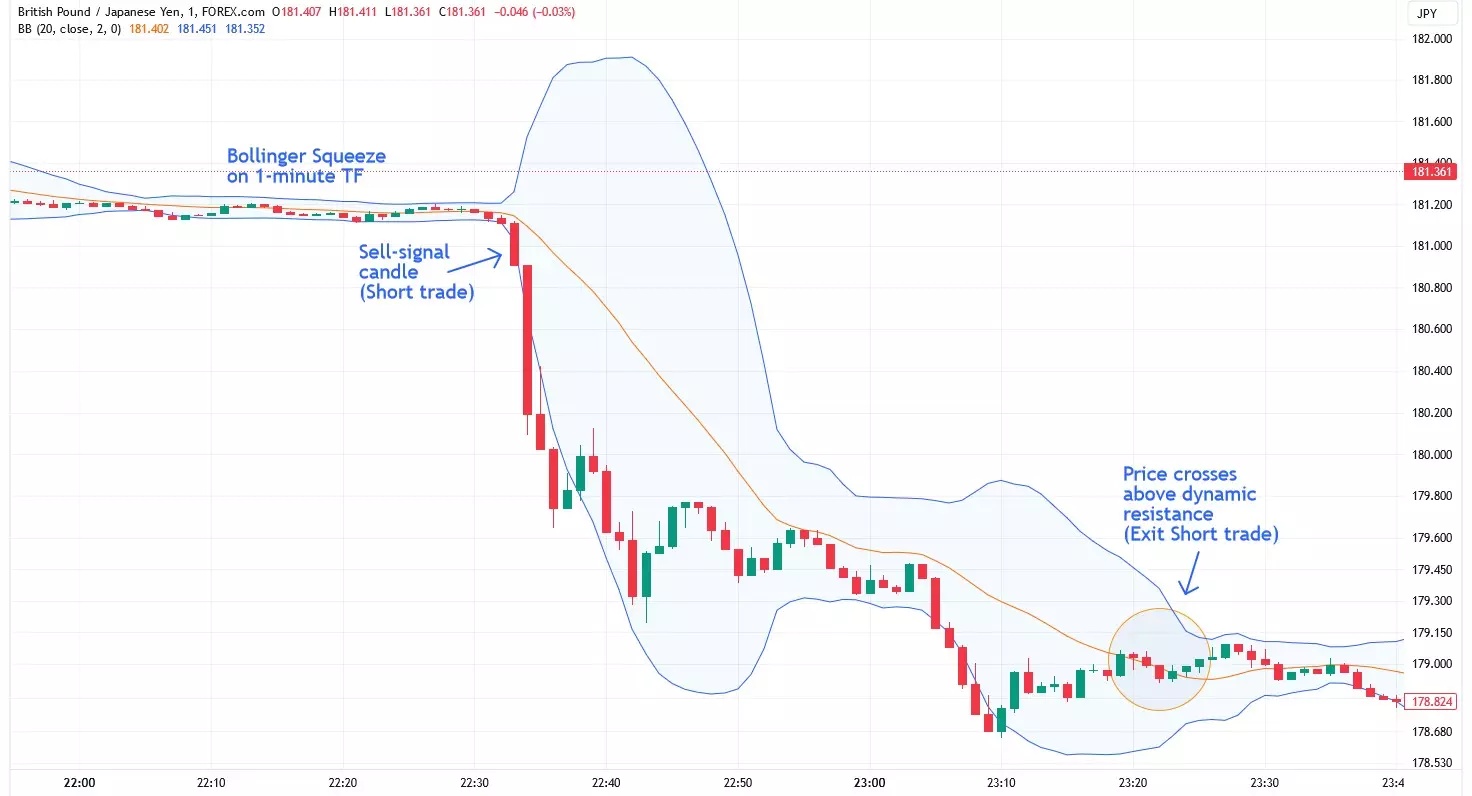
Volatility insights from Bollinger Bands
Bollinger Bands help identify volatility and potential reversals. By analyzing the width of the bands and the position of prices relative to the bands, traders gain insights into the market's volatility.
Strength measurement with RSI
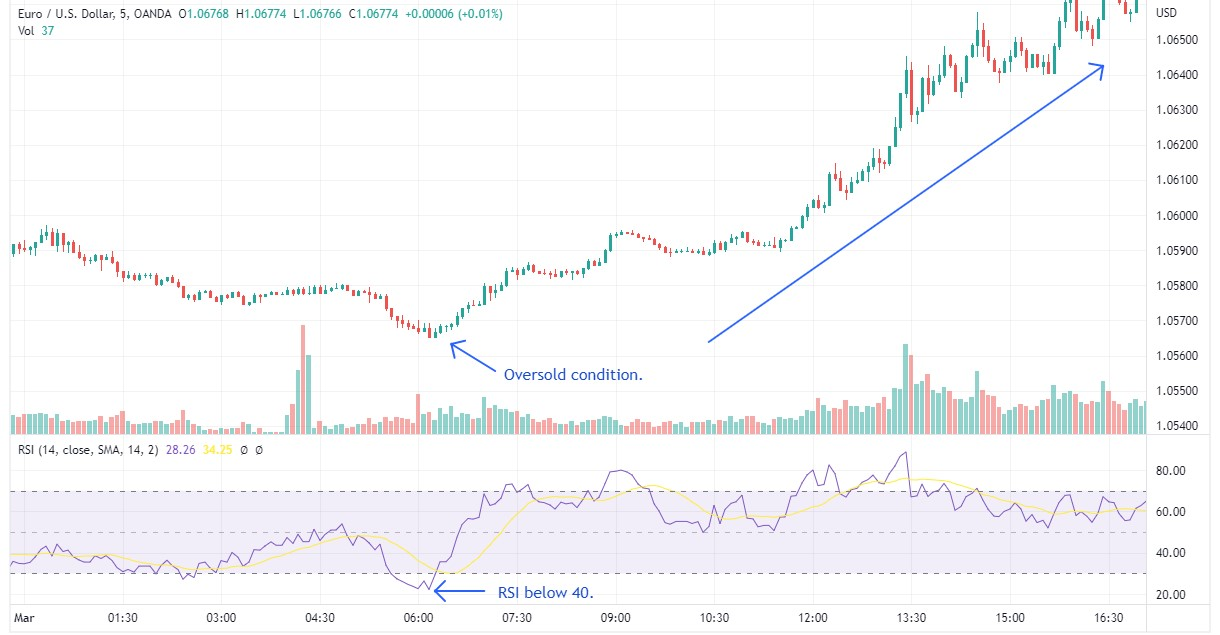
Strength measurement with RSI
The Relative Strength Index (RSI) gauges the strength of price movements. It provides a numerical measure that helps traders assess whether an asset is overbought or oversold, contributing to better-informed trading decisions.
Best binary options brokers


Advanced performance analysis techniques
Backtesting and historical performance analysis
Backtesting involves applying trading strategies to historical market data to evaluate their performance. Traders use backtesting tools to simulate how a strategy would have performed in past market conditions. This allows for the analysis of entry and exit points, profitability, and risk exposure. Backtesting is a crucial step in determining the effectiveness of a trading strategy. It helps identify strengths and weaknesses by providing insights into how the strategy would have performed under different market scenarios. Traders can assess whether the strategy aligns with their goals and risk tolerance.
Identifying strengths and weaknesses through backtesting
Backtesting allows traders to assess the profitability of a strategy by calculating metrics such as total profits, average profits per trade, and the profit factor (the ratio of total profits to total losses). This assessment helps traders understand the financial implications of the strategy.
Historical performance analysis through backtesting provides a comprehensive view of risk exposure. Traders can identify periods of heightened risk, drawdowns, and potential losses. This analysis is crucial for implementing risk management strategies and understanding the overall risk profile of the trading approach.
Backtesting also reveals the adaptability of a strategy to different market conditions. Traders can observe how the strategy performs in various scenarios, helping them determine its robustness. Strategies that demonstrate consistent performance across diverse market conditions are generally more reliable.
Optimizing trading strategies based on performance analysis
Performance analysis serves as a powerful tool for traders to identify areas of weakness within their strategies. These weaknesses could occur as inconsistent win rates, excessive drawdowns, or lapses in risk management practices. Pinpointing these areas is crucial for enhancing overall strategy effectiveness.
Refining trading rules and parameters
Adjusting entry and exit criteria
Performance analysis provides valuable insights into the effectiveness of entry and exit criteria. Traders can refine their strategies by adjusting these criteria based on historical performance data. For example, if certain entry signals consistently lead to losses, modifications can be made to improve the strategy's overall performance.
Optimizing position sizing
Traders can use performance analysis to evaluate the impact of different position sizes on overall profitability and risk exposure. Optimizing position sizing based on historical performance helps strike a balance between risk and reward.
Enhancing risk management techniques
Traders can refine their risk mitigation strategies by identifying periods of heightened risk and assessing the impact of various risk management approaches. This ensures better protection of trading capital.
Developing personalized trading plans
Individual risk tolerance
Every trader has a unique risk tolerance level. Performance analysis allows traders to understand how well their strategies align with their risk tolerance. Creating a personalized trading plan involves setting risk parameters that resonate with an individual's comfort level, reducing the likelihood of emotional decision-making.
Adapting to trading style
Traders employ diverse trading styles, from day trading to swing trading. Analyzing performance data helps in aligning trading plans with the chosen style. For instance, a day trader may focus on short-term strategies, while a swing trader might look for patterns over a more extended timeframe.
Aligning with performance goals
Performance analysis aids in assessing progress toward performance goals. Traders can develop personalized trading plans that reflect their specific financial objectives. Whether the goal is consistent monthly profits, capital preservation, or aggressive growth, the trading plan becomes a roadmap to achieving these objectives.
Expert tips and tricks for enhanced performance analysis
Look for discreet candlestick formations
While common candlestick patterns are well-known, identifying and utilizing rare patterns can provide traders with a unique advantage. These patterns, although infrequent, may offer high-profit potential. Traders should invest time in learning and recognizing these less conventional formations.
Rare candlestick patterns often signal unusual market behavior, leading to high-profit potential. Traders who can accurately interpret and act upon these patterns may find opportunities for significant returns.
Incorporating psychological factors into candlestick pattern analysis
Understanding trader psychology
Successful traders acknowledge the impact of emotions on decision-making. Incorporating psychological factors into candlestick pattern analysis involves recognizing how emotions can influence interpretation and execution.
Discipline and patience
Trading discipline and patience are psychological attributes crucial for effective performance analysis. Traders should remain disciplined in following their plans and patient in waiting for optimal setups based on candlestick patterns.
Glossary for novice traders
-
1
Leverage
Forex leverage is a tool enabling traders to control larger positions with a relatively small amount of capital, amplifying potential profits and losses based on the chosen leverage ratio.
-
2
Bollinger Bands
Bollinger Bands (BBands) are a technical analysis tool that consists of three lines: a middle moving average and two outer bands that are typically set at a standard deviation away from the moving average. These bands help traders visualize potential price volatility and identify overbought or oversold conditions in the market.
-
3
Swing trading
Swing trading is a trading strategy that involves holding positions in financial assets, such as stocks or forex, for several days to weeks, aiming to profit from short- to medium-term price swings or "swings" in the market. Swing traders typically use technical and fundamental analysis to identify potential entry and exit points.
-
4
Day trading
Day trading involves buying and selling financial assets within the same trading day, with the goal of profiting from short-term price fluctuations, and positions are typically not held overnight.
-
5
Risk Management
Risk management is a risk management model that involves controlling potential losses while maximizing profits. The main risk management tools are stop loss, take profit, calculation of position volume taking into account leverage and pip value.
Related Articles


Team that worked on the article

Chinmay Soni is a financial analyst with more than 5 years of experience in working with stocks, Forex, derivatives, and other assets. As a founder of a boutique research firm and an active researcher, he covers various industries and fields, providing insights backed by statistical data. He is also an educator in the field of finance and technology.
As an author for Traders Union, he contributes his deep analytical insights on various topics, taking into account various aspects.

Dr. BJ Johnson is a PhD in English Language and an editor with over 15 years of experience. He earned his degree in English Language in the U.S and the UK. In 2020, Dr. Johnson joined the Traders Union team. Since then, he has created over 100 exclusive articles and edited over 300 articles of other authors.

Mirjan Hipolito is a journalist and news editor at Traders Union. She is an expert crypto writer with five years of experience in the financial markets. Her specialties are daily market news, price predictions, and Initial Coin Offerings (ICO).
