Stock Market Sentiment Analysis


Editorial Note: While we adhere to strict Editorial Integrity, this post may contain references to products from our partners. Here's an explanation for How We Make Money. None of the data and information on this webpage constitutes investment advice according to our Disclaimer.
Stock market sentiment analysis is the process of gauging the overall attitude or mood of investors toward a particular market or stock. It involves analyzing data such as news articles, social media posts, financial reports, and other qualitative sources to determine whether sentiment is bullish (positive) or bearish (negative). Key tools for sentiment analysis include natural language processing (NLP) algorithms, machine learning models, etc.
The stock market is an arena where the emotions of investors and traders can outweigh any facts and forecasts. Understanding what lies behind these emotions can give you a significant advantage. But how can you tell when the crowd is panicking and when it is acting on confidence? What tools will help you not only follow the market, but also anticipate its movements? In this article, we will look at key tools that will allow you to decipher the market sentiment and create a strategy that not only reacts to changes, but also gets ahead of them.
What is a stock market sentiment analysis
Stock market sentiment analysis is a method of assessing the overall attitude or mood of market participants towards a particular stock, sector, or the market as a whole. The goal of this analysis is to understand how investor and trader sentiment may influence price movements by identifying whether the prevailing market sentiment is optimistic (bullish) or pessimistic (bearish).
Market sentiment has a significant impact on price behavior because investor actions are often driven not only by fundamental data but also by emotions, expectations, and news. For instance, even if a company has strong financial performance, negative news or social media trends could lead to a wave of selling and a drop in stock prices. Sentiment analysis helps traders anticipate such market reactions by analyzing qualitative data like news articles, social media posts, financial reports, and expert opinions.
Stock market sentiment analysis tools
Stock market sentiment analysis is an assessment of the general sentiment and expectations of market participants. Since investor and trader sentiment is one of the factors influencing the price movements of traded assets, stock market sentiment analysis is an important tool.
Social media sentiment analysis tools
Social media content analysis tools like BuzzSumo and Hootsuite allow you to monitor mentions of stocks, indexes, and other financial assets on social media. These tools use natural language processing (NLP) algorithms to evaluate the sentiment of posts — positive, negative, or neutral. If a stock is frequently discussed with a positive connotation, it can indicate growing interest and potential price growth. An example of this was GameStop in 2021. Discussions about GameStop on forums and social media contributed to a sharp jump in its price, illustrating how online sentiment can influence the market.
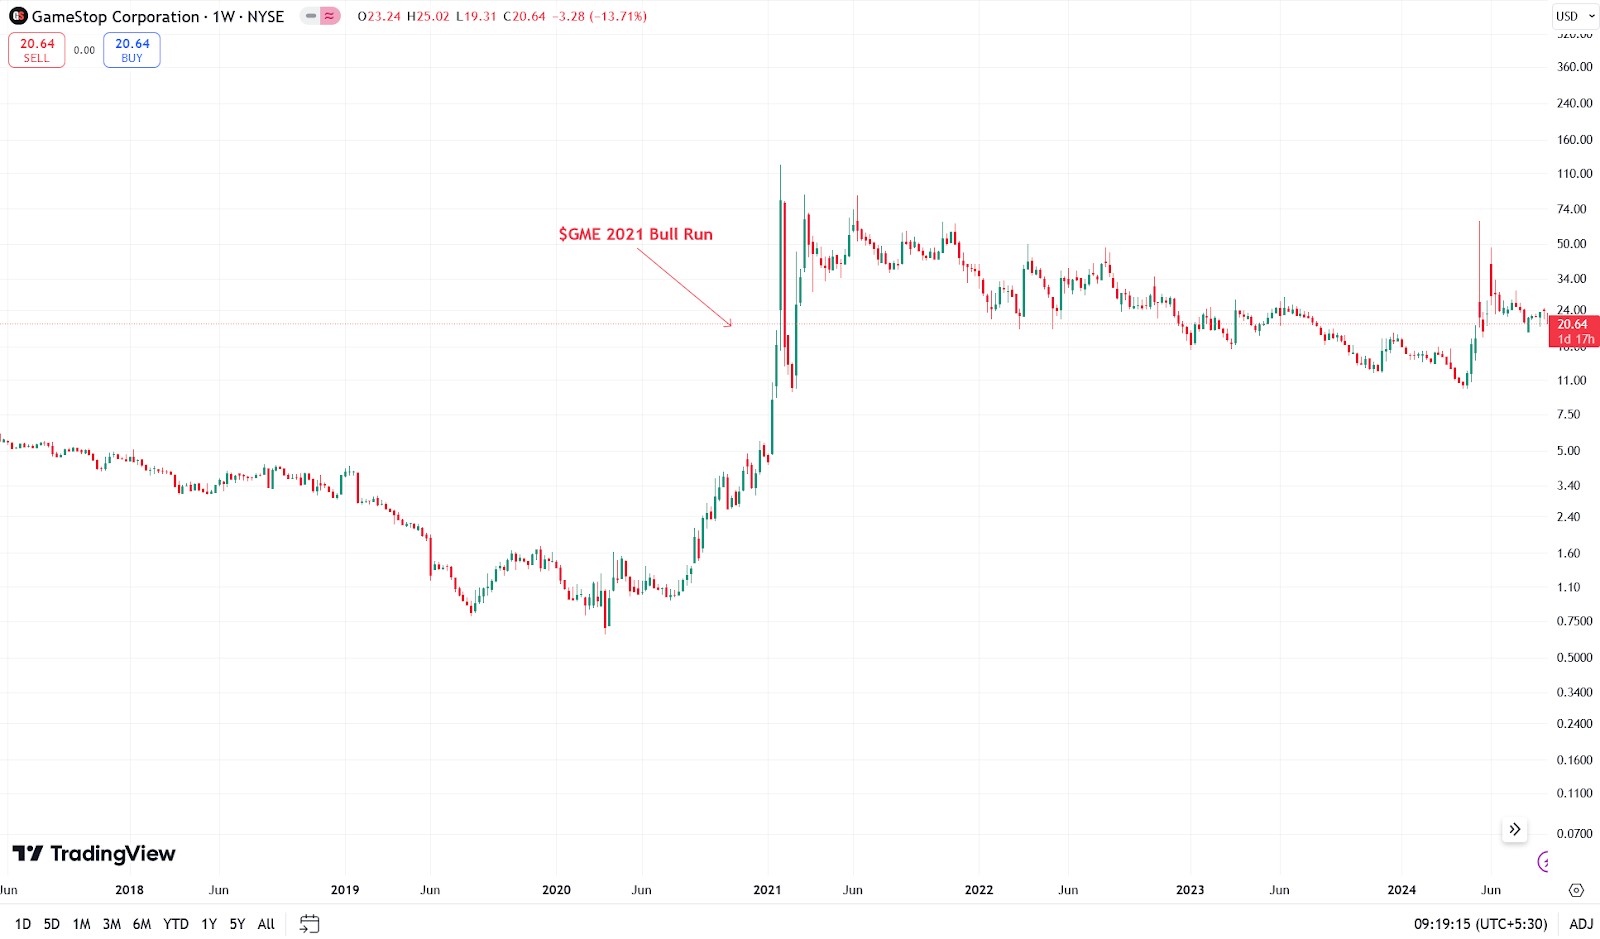 $GME 2021 Bull Run
BuzzSumo includes features like:
Content analysis. You can identify the content that resonates most with users. For example, you can track which stocks are discussed the most and with what sentiment.
Influencer activity analysis. Users can find key influencers in a particular niche and track their influence on the agenda.
Trend detection. BuzzSumo collects content data and analyzes trends based on post frequency and reach.
Hootsuite is an all-in-one social media management and sentiment analysis platform. Features include:
Social monitoring. Hootsuite lets you track mentions of specific keywords, phrases, or hashtags in real time, which is useful for understanding sentiment around a stock.
Sentiment analysis. Using natural language processing (NLP) algorithms, Hootsuite analyzes whether assets are being discussed with positive, neutral, or negative sentiment.
Post scheduling. The tool is also useful for managing social media content, allowing users to schedule posts and see audience responses.
Analytics. Includes engagement, reach, and mention reports to help identify market sentiment.
Fear and Greed Index
Developed by CNN Money in 2012, this index measures sentiment based on seven different factors:
Equity market momentum. Measures the difference between the current S&P 500 Index and its 125-day moving average.
Equity strength. The percentage of stocks on the New York Stock Exchange that have made new 52-week highs or new 52-week lows.
Market breadth. The ratio of the volume of advancing stocks to the volume of declining stocks.
Put/call options. The number of put options versus call options.
An index of 0-49 indicates fear, while 50-100 indicates greed. When the index rises to 80 or higher, investors may begin to fear that the market is overheating, which in turn can lead to selling and correction. During periods of high volatility, the index often becomes an indicator of a trend reversal.
TradingView and Bloomberg Terminal
Both TradingView and Bloomberg Terminal are renowned for their effectiveness in market analysis, but they are aimed at different audiences.TradingView is a more accessible and flexible platform for traders, offering powerful analysis tools and an intuitive interface. Bloomberg Terminal, on the other hand, is a comprehensive solution for professionals with deep access to world-class data and analytics.
TradingView is an online technical analysis and charting platform used by both beginner and professional traders. TradingView's key features include:
Real-time charts. The platform provides interactive charts for a variety of financial assets, such as stocks, cryptocurrencies, futures, Forex, bonds, and indices. Charts can be customized to any time frame, from minutes to weeks or months.
Indicators. TradingView offers over 100 built-in technical indicators, including popular ones such as RSI (Relative Strength Index), MACD (Moving Average Convergence Divergence), Stochastics, and Moving Averages. These indicators help users analyze price dynamics and identify potential for opening or closing positions.
Trading volume analysis. TradingView allows you to monitor volumes on all supported markets and use it to confirm trends.
Trading signals and alerts. The platform allows users to set up alerts based on various conditions (e.g. price crossing a certain support or resistance line, volume change, etc.). These signals can be sent in real time to email or as push notifications, allowing you to quickly react to market changes.
Bloomberg Terminal is a multifunctional trading platform used by professional traders, analysts and financial institutions for deep market analysis and access to unique information. It is one of the most comprehensive tools on the market. Key features of Bloomberg Terminal:
Real-time data. Bloomberg provides access to real-time trading data on all global exchanges. The platform covers all asset classes: stocks, bonds, currencies, derivatives, commodities and indices. Users can receive data on trading volumes, price changes and liquidity with an accuracy of up to a second.
Market depth (Level 2). Bloomberg Terminal allows you to analyze the market depth - the number of buy and sell orders at different price levels. This information helps you understand where the main trading volumes are concentrated and what the liquidity of the asset is at the moment. This is critical for professional traders who make large transactions and must take into account market liquidity.
Asset liquidity. Bloomberg offers advanced data on asset liquidity, including trading volume estimates, order book analysis and liquidity distribution. This helps users make decisions about opening positions based on the availability of trading volumes.
Consumer Sentiment Index
The Consumer Sentiment Index, developed by the University of Michigan, is a monthly measure of consumer confidence in the economy. The index is based on surveys that measure consumers' current financial situation and expectations for the future. Survey data provides information about public sentiment that can influence economic trends.
Key aspects of the surveys:
Current financial situation. Participants assess their current income, spending, and overall financial strength.
Consumer expectations. Future expectations include personal income projections, overall economic conditions, and purchase plans, especially for major items such as cars, homes, and appliances.
Confidence in the economy. The survey includes confidence in economic policy, unemployment, and inflation.
How to develop trading strategies based on sentiment analysis
Strategies based on stock sentiment provide the ability to make decisions that outpace market movements and provide a competitive advantage. Let's look at a few strategies that use sentiment analysis tools to develop and optimize trading decisions.
Contrarian strategy
Countertrend trading involves taking positions against the current market trend based on the assumption that the market will soon reverse. For example, if sentiment analysis shows that the market is greedy and most investors are confident that the rally will continue, a countertrend trader might take a short position, expecting a correction.
Application example. Let's say the Fear & Greed index peaks, indicating excessive optimism. In this situation, a counter-trend trader can sell assets or open a short position, anticipating a market decline.
Trend-following strategy based on sentiment
Trend-following strategy involves opening positions in the direction of the prevailing trend when sentiment analysis confirms its strength. For example, if sentiment analysis tools show that investor sentiment remains positive while the price of a stock rises, a trader continues to follow the trend until there are signs of weakening.
Application example. If social media and news feed data tracked by tools such as Talkwalker or Brandwatch show a steady increase in positive sentiment, this confirms the trend and provides a signal to continue holding long positions.
Sentiment divergence strategy
Divergence occurs when investor sentiment diverges from price action. For example, if a stock price rises but sentiment becomes increasingly negative, this may signal an imminent reversal. Traders use this information to open positions that are contrary to the current trend.
Application example. The stock price continues to rise, but trading volumes are falling and sentiment analysis tools are showing an increase in negative sentiment. In this situation, a trader may want to consider opening a short position in anticipation of a correction.
News and sentiment event-driven strategy
Market reactions to important news are often predictable if you understand how they affect sentiment. For example, sudden changes in the tone of news headlines can cause sharp price movements. This strategy involves using sentiment analysis tools to quickly analyze sentiment after a news release and open positions based on this data.
Application example. Following the company’s quarterly earnings announcement, sentiment analysis tools are showing a sharp decline in sentiment despite strong financials. This could be a signal to sell the stock, as the market may be overestimating positive results.
To test your trading strategies based on stock sentiment analysis, we have selected several brokers. The key criteria when choosing a broker are low commissions, access to a wide range of assets, platform convenience, quality of analytical tools, as well as the reputation and reliability of the company.
| Broker | Demo | Min. account, $ | Signals (Alerts) | Research and data | Open an account |
|---|---|---|---|---|---|
| eToro | Yes | 100 | Yes | Yes | Open an account Your capital is at risk.
|
| DEGIRO | No | 0 | No | Yes | Study review |
| CapTrader | Yes | 2000 | Yes | Yes | Open an account Your capital is at risk.
|
| Revolut | No | 0 | No | Yes | Study review |
| Interactive Brokers | Yes | 0 | Yes | Yes | Open an account Your capital is at risk. |
Automating data analysis will allow you to react faster and make more accurate decisions

Sentiment analysis requires more than just tracking current trends; it requires a deep understanding of how the thoughts of others are influencing the market and where those thoughts will go. Use multiple tools and sources to assess sentiment holistically. This will help you see beyond the numbers and better understand market dynamics.
To effectively use the data you receive, automate your analysis processes. Tools that collect information in real time will allow you to react to changes faster and make more accurate decisions. Don’t just rely on one source, combine data from several to minimize risk.
For successful trading, it is important to identify clear signals for entering and exiting positions. Set specific criteria based on sentiment analysis and act as soon as they are met. This will allow you to avoid emotional decisions and maintain stability in your strategy.
Conclusion
Market sentiment analysis provides traders with a deeper understanding of what drives the market. Modern analysis tools help with this. They allow you to see not only the current sentiment, but also predict its impact on future price movements. A systematic approach and a combination of different analysis methods help traders adapt to changing market conditions. This allows them to make more informed decisions and act with confidence, even in uncertain conditions. By applying the strategies described, traders will receive practical tools for achieving consistent success in trading.
FAQs
How can market sentiment influence long-term investment strategies?
Market sentiment can cause short-term price movements, which sometimes present opportunities for long-term investors. For example, panic selling can cause quality stocks to be undervalued, creating opportunities to buy at a discount. Long-term investors can use sentiment analysis to identify periods when markets are overreacting and act on fundamentals.
What is the risk of relying too much on sentiment analysis?
Relying too much on sentiment analysis can lead to ignoring fundamental factors such as company profitability or economic conditions. The market may behave irrationally for longer than expected, increasing the risk of making poor decisions. Therefore, it is important to use sentiment analysis in combination with other methods to obtain a more balanced assessment.
How can market sentiment influence market volatility?
Sharp changes in sentiment are often accompanied by increased volatility. For example, when investors switch from optimism to pessimism, it can cause stocks to sell off quickly and cause large price swings. Likewise, unexpected positive news can lead to a buying spree and sharp price increases. Sentiment analysis can help you anticipate these periods of increased volatility and adjust your trading strategies accordingly.
How can you use historical sentiment data to predict future movements?
Historical sentiment data can show how the market has responded to similar sentiments in the past. For example, if certain levels of optimism or pessimism have led to certain price movements in the past, it can help predict similar behavior in the future. Analyzing historical sentiment trends can be useful for developing long-term trading strategies.
Related Articles
Team that worked on the article
Oleg Tkachenko is an economic analyst and risk manager having more than 14 years of experience in working with systemically important banks, investment companies, and analytical platforms. He has been a Traders Union analyst since 2018. His primary specialties are analysis and prediction of price tendencies in the Forex, stock, commodity, and cryptocurrency markets, as well as the development of trading strategies and individual risk management systems. He also analyzes nonstandard investing markets and studies trading psychology.
Also, Oleg became a member of the National Union of Journalists of Ukraine (membership card No. 4575, international certificate UKR4494).
Chinmay Soni is a financial analyst with more than 5 years of experience in working with stocks, Forex, derivatives, and other assets. As a founder of a boutique research firm and an active researcher, he covers various industries and fields, providing insights backed by statistical data. He is also an educator in the field of finance and technology.
As an author for Traders Union, he contributes his deep analytical insights on various topics, taking into account various aspects.
Mirjan Hipolito is a journalist and news editor at Traders Union. She is an expert crypto writer with five years of experience in the financial markets. Her specialties are daily market news, price predictions, and Initial Coin Offerings (ICO).
An investor is an individual, who invests money in an asset with the expectation that its value would appreciate in the future. The asset can be anything, including a bond, debenture, mutual fund, equity, gold, silver, exchange-traded funds (ETFs), and real-estate property.
Risk management is a risk management model that involves controlling potential losses while maximizing profits. The main risk management tools are stop loss, take profit, calculation of position volume taking into account leverage and pip value.
The fear and greed index is a tool that measures the sentiment of the crypto market based on various indicators. It assigns a value between 0 and 100, where 0 represents extreme fear while 100 represents extreme greed. The index can help investors avoid emotional overreactions and make rational decisions.
Trend trading is a trading strategy where traders aim to profit from the directional movements of an asset's price over an extended period.
Cryptocurrency is a type of digital or virtual currency that relies on cryptography for security. Unlike traditional currencies issued by governments (fiat currencies), cryptocurrencies operate on decentralized networks, typically based on blockchain technology.

-
 Afghanistan
-
 Albania
-
 Algeria
-
 Argentina
-
 Armenia
-
 Australia
-
 Austria
-
 Azerbaijan
-
 Bahamas
-
 Bahrain
-
 Bangladesh
-
 Belgium
-
 Botswana
-
 Brazil
-
 Brunei
-
 Bulgaria
-
 Burma
Burma
-
 Cambodia
-
 Cameroon
-
 Canada
-
 Chile
Chile
-
 China
China
-
 Colombia
-
 Costa Rica
-
 Cote d'Ivoire
-
 Croatia
-
 Cyprus
-
 Czech Republic
-
 Denmark
-
 Dominican Republic
-
 Ecuador
-
 Egypt
Egypt
-
 Estonia
-
 Eswatini
-
 Ethiopia
-
 Finland
-
 France
-
 Georgia
-
 Germany
-
 Ghana
Ghana
-
 Greece
-
 Haiti
Haiti
-
 Hong Kong
-
 Hungary
-
 India
India
-
 Indonesia
-
 Iran, Islamic republic
-
 Iraq
Iraq
-
 Ireland
-
 Israel
-
 Italy
Italy
-
 Jamaica
-
 Japan
Japan
-
 Jordan
-
 Kazakhstan
-
 Kenya
Kenya
-
 Korea
Korea
-
 Kuwait
-
 Kyrgyzstan
-
 Laos
Laos
-
 Latvia
-
 Lebanon
-
 Libyan Arab Jamahiriya
-
 Lithuania
-
 Luxembourg
-
 Macedonia
-
 Madagascar
-
 Malaysia
-
 Malta
Malta
-
 Mauritius
-
 Mexico
-
 Moldova
-
 Mongolia
-
 Montenegro
-
 Morocco
-
 Mozambique
-
 Namibia
-
 Nepal
Nepal
-
 Netherlands
-
 Nigeria
-
 Norway
-
 Oman
Oman
-
 Pakistan
-
 Palestine
-
 Papua New Guinea
-
 Peru
Peru
-
 Philippines
-
 Poland
-
 Portugal
-
 Puerto Rico
-
 Qatar
Qatar
-
 Romania
-
 Rwanda
-
 Saudi Arabia
-
 Serbia
-
 Singapore
-
 Slovakia
-
 Slovenia
-
 Somalia
-
 South Africa
-
 Spain
Spain
-
 Sri Lanka
-
 Sweden
-
 Switzerland
-
 Syrian Arab Republic
-
 Taiwan
-
 Tajikistan
-
 Tanzania, United Republic Of
-
 Thailand
-
 Trinidad and Tobago
-
 Tunisia
-
 Turkey
-
 UAE
UAE
-
 Uganda
-
 Ukraine
-
 United Kingdom
-
United States
-
 Uzbekistan
-
 Venezuela
-
 Vietnam
-
 Yemen
Yemen
-
 Zambia
-
 Zimbabwe
- Forex
- Crypto

