Bullish and bearish RSI divergence
Divergence is considered to be one of the strongest oscillator signals. Regular divergence indicates an imminent change in the direction of price movement. Hidden divergence indicated trade continuation. Despite the signal being strong, novice traders often experience difficulty in identifying it.
This review will help you answer several questions:
What is divergence? What are the types of divergence?
How do you build reference lines and interpret their signals?
How do you use divergence in a trading strategy using the example of RSI oscillator?
This will be of particular use for novice traders.
What is divergence: meaning, signals, indicators
A divergence occurs when the price moves in the opposite direction of the indicator. This happens, when the leading indicator ‘sees’ an imminent price reversal, while the price moves in the ‘old’ direction by inertia. This is possible thanks to the formula of leading indicators that compare the current candles with candles of earlier periods, filtering the intermediate sections. Therefore, divergence is usually sought on higher timeframes and on long sections.
Types of divergences
General rules for drawing a divergence:
-
The lines indicating a divergence are drawn exclusively on extremes. If there is a divergence, but the indicator is moving up/down without clear extremes, the signal is considered weak. The sharper the extreme, the better.
-
It is desirable for the first extreme of the indicator to be in the overbought/oversold zone.
-
It is desirable for the angle of convergence/divergence between the price and the oscillator to be as big as possible.
-
The reference lines are drawn on the extremes of the candle body, not the extremes of shadows.
Oscillators are used to search for divergences. They are considered to be leading indicators, because they signal about possible price movement direction and its change earlier. Also, they are drawn under the price chart, which is convenient from the visual standpoint.
The best indicators for divergence include RSI, Stochastic, CCI and MACD. A combination of two oscillators can be used to confirm the signal, for example RSI and Stochastic – they are similar in essence, but differ by the calculation formula. In the following examples, we review divergence using the RSI indicator.
Description of RSI indicator: meaning, settings, area of use
RSI, or the Relative Strength Index, shows the level to which an asset is overbought or oversold. The indicator is drawn under the price chart, and moves within the range of 0-100. Zones below 30 and higher than 70 are considered the oversold and overbought zones respectively.
Things to know about RSI:
-
It is a leading oscillator; one of the basic indicators on the majority trading platforms.
-
It is an indicator with minimum settings. Only the period and type of price used for the calculation are specified. For timeframes H1-H4, it is recommended to leave the default period of 14.
-
It is used in trend trading strategies as an indicator confirming signals.
How to use RSI. The main signals of the indicator are the reversals in overbought/oversold zones and divergence.
Types of RSI divergence
There are several types of divergences:
-
Class A are clear divergences/convergences. They are quickly found on the chart visually and are considered as reliable signals. These include bullish and bearish divergences.
-
Class B are weak divergences/convergences, with extremes of the indicator on different levels, and price extremes practically on one level.
-
Class C are weak divergences/convergences, with extremes of the indicator practically on the same level and price extreme on different levels.
There is a hidden divergence, which is also divided into three classes. The differences are the extremes the reference line is drawn on.
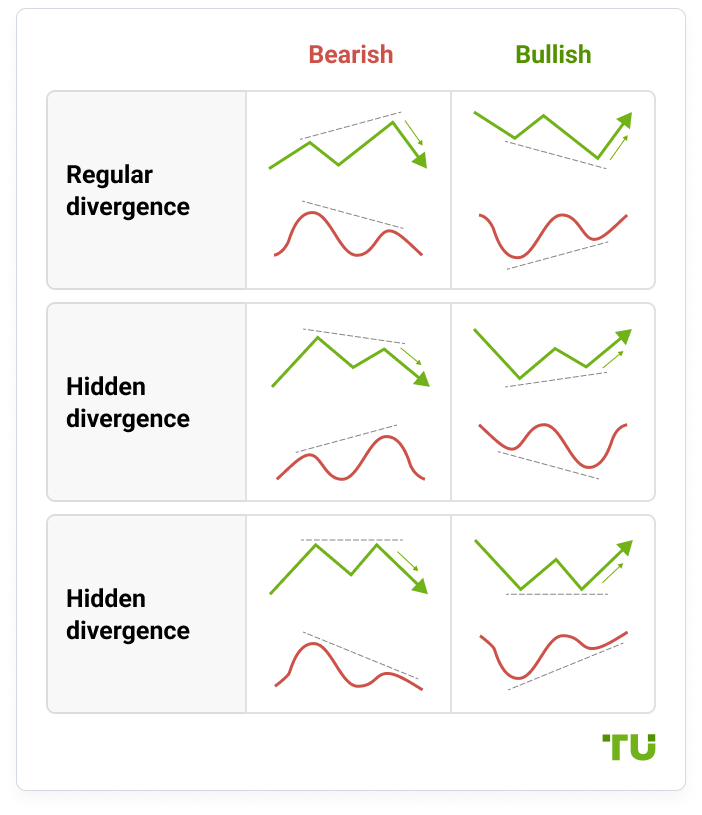
Bullish and bearish divergences
Bullish divergence is called convergence, and bearish – divergence.
Rules for drawing:
-
Bullish divergence is drawn on the price and RSI lows. The price lows are moving down, and the RSI lows are moving up.
-
Bearish divergence is drawn on the price and RSI highs. The price highs are moving up, and the RSI highs are moving down.
Example 1.
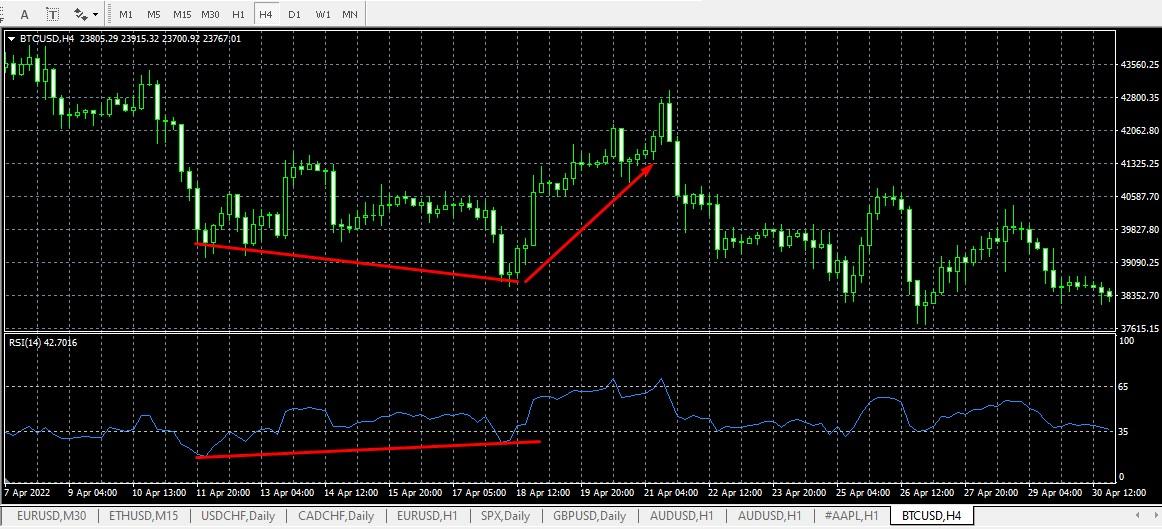
Divergence Example
Example of strong bullish divergence of Class A. A convergence is visible on the BTC/USD chart on the timeframe H4. The price lows are decreasing, RSI (14) lows are growing. A strengthening signal is the first RSI low near the level of 20, i.e. in the oversold zone. The fact that the oscillator bounces off this level speaks about the growing buyers’ power.
Example 2.
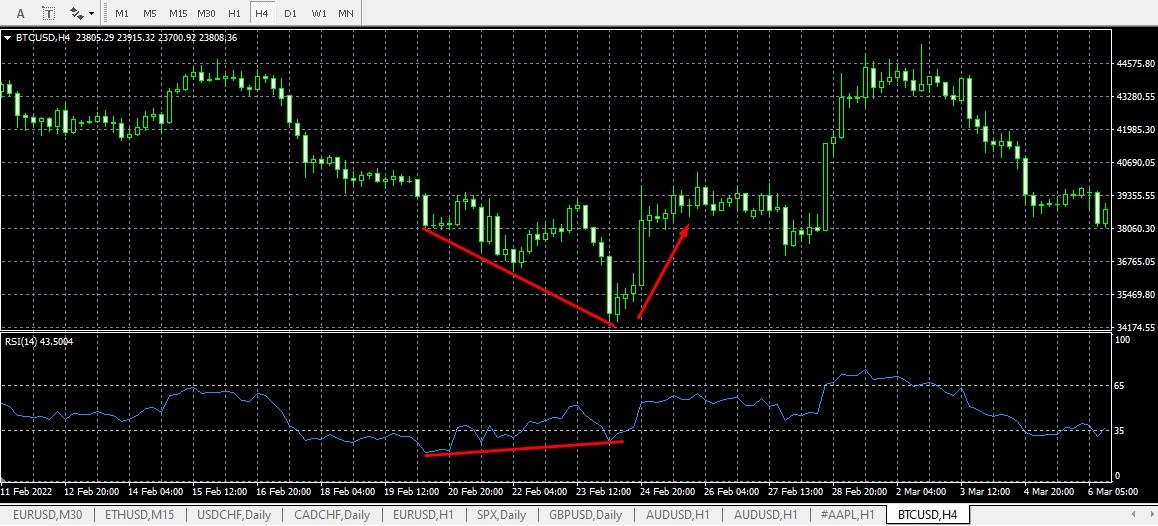
Divergence Example
Here, the signal is even stronger. RSI bounces of the level 30, which can also be considered the edge of the oversold zone, the downward reference line of the price is drawn on the three extremes, the last falling candle has an abnormally long body (the last impulse of bears), the reference lines of the price and indicator have a big angle of convergence.
Example 3.
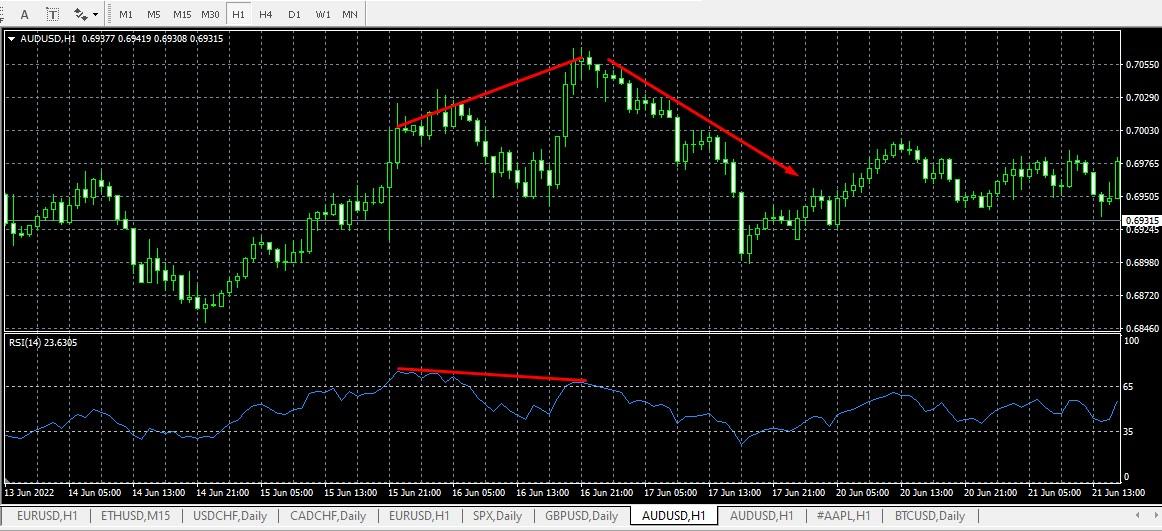
Divergence Example
Example of bearish divergence of Class A. The RSI highs are moving downward, but the price highs are moving up at a big angle.
Hidden divergence of RSI
Unlike regular divergence that predicts price reversal, hidden diversion confirms the existing trend:
Hidden bullish diversion is drawn on the price and RSI lows. Price lows are moving up and RSI lows are moving down.
Hidden bearish divergence is drawn on the price and RSI. Price highs are moving down and RSI highs are moving up.
There is also an extended RSI divergence. It is similar to the regular one, but provides for a more complex design of extremes and is often mistaken for Class B divergence. Since hidden and extended divergences are rare and difficult to visually identify, novice traders should not try to look for them.
Classic mistakes in searching for RSI divergence
Ignoring fundamental factors. Divergence is a technical instrument, the logic of appearance of which can be broken at any moment by a fundamental factor. Regardless of how clear the prediction of price divergence may seem, the price can reverse in the opposite direction at any time.
Tip. If you see a divergence forming, check the economic calendar. If there are key events around (publication of statistics, reports, etc.) that concern your asset, do not rush to react to the signal.
Early reaction to divergence. “Wishful thinking”. RSI divergence has clear signs: clear price and indicator extremes located relatively far from each other. You need to learn to see visually. Divergence is often mistaken for increased price volatility.
Tip. Don’t rush to open a position on a signal. If you see a divergence, wait for the signal confirming price reversal, for example, a reversal pattern, price movement away from the trend line or strong support/resistance level.
Mistake in combining sections. If you are looking for divergence, the extremes must be within one range. You cannot take RSI extremes on the section from July 29 until September 1, and price extremes – from July 29 until August 15. The example of the mistake is shown below:
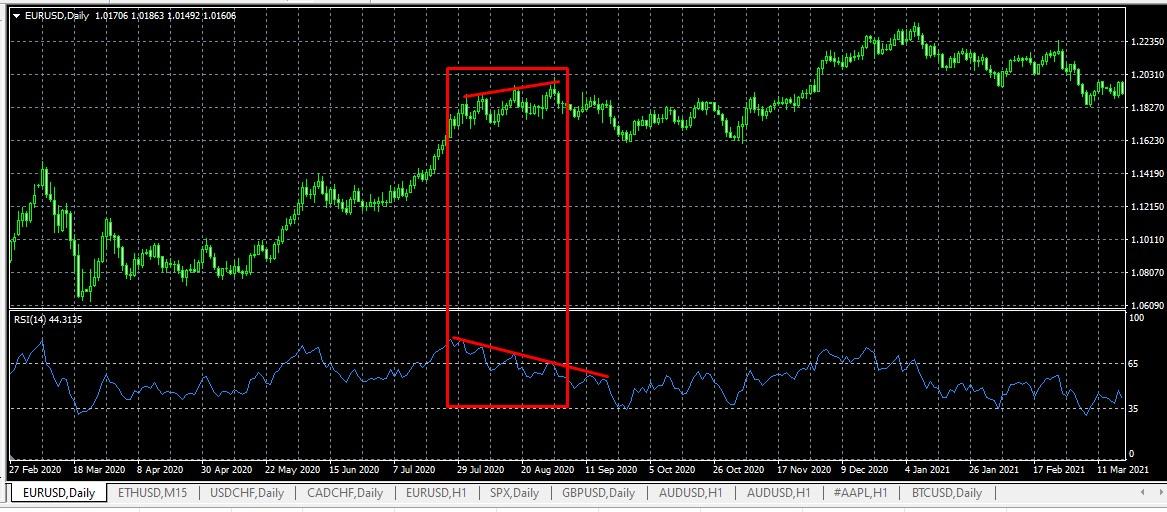
Mistake in combining sections
A seemingly strong diversion is an illusion, because if you take the extremes on one section, a diversion of Class B with violation of the mandatory rule of consecutive upward highs. The signal is very weak.
Tip. Look for simultaneous indicator signals in the same section, use additional filters. Don’t try to see something that isn't really there.
You can learn to see divergence. It comes with experience. In order to learn to see divergence, install a line price chart – the lines are better perceived visually. And zoom out.
Custom indicators are another way to look for divergence. It could be either a combined indicator or an add-on. DivergenceViewer_AD is an example of an add-on for MT4. It is added to the platform as a regular indicator. In the settings, the type of the basic instrument is specified (RSI, CCI, Momentum, Stochastic, etc.), which will be used to determine divergences. Also the maximum duration of a divergence is specified.
Examples of combined indicators for searching for divergences: DTosc 2.06 Multi RSI, MFI+RSI Divergence TT, Adaptable_RSI + smoothing + divergence 2.
Example of a trading strategy with RSI divergence
In the trading strategies we are using as an example, Stochastic, which is also used for searching for overbought and oversold zones, is used as an additional filter. Currency pair – EUR/USD, timeframe – H4. On this timeframe, a late entry is allowed, confirmed by several signals. 4-5 candles are enough for profit.
We analyze the chart and look for a divergence.
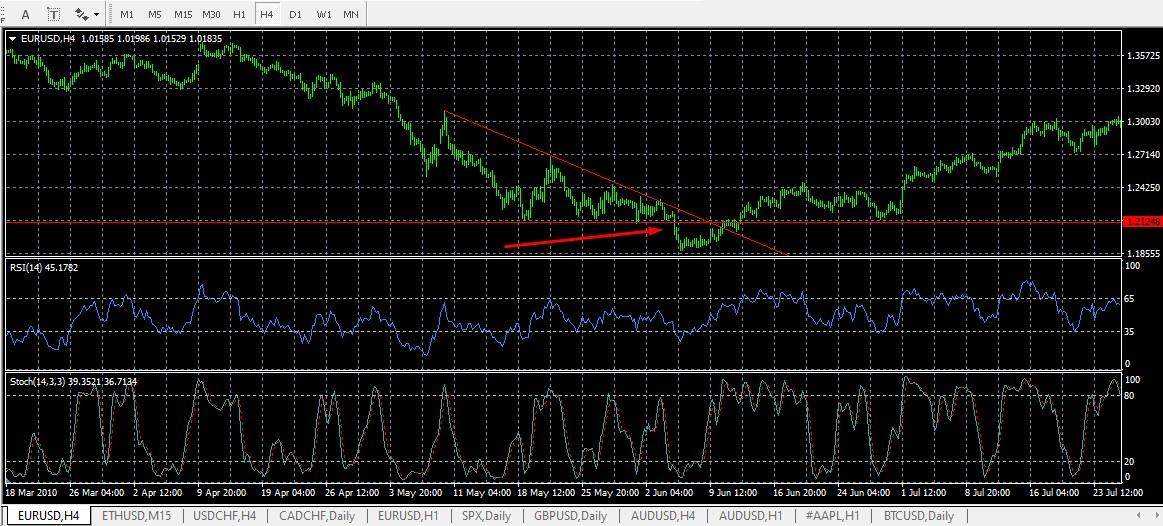
Divergence on the chart
The chart shows a long-term downward trend, which should end sooner or later. The task is to determine the reversal point. Oscillators are used only as confirming instruments.
A strong pattern – Triangle is formed on the chart. It is formed by the horizontal support level, built on three points and the trend line built on four points. There are two ways this figure could continue:
Breakout of the support level down – continuation of a strong downward trend.
Breakout of the trend line up – a new upward trend.
In this case, we see the breakout down
We now look for the signal confirming downward movement, and zoom in.
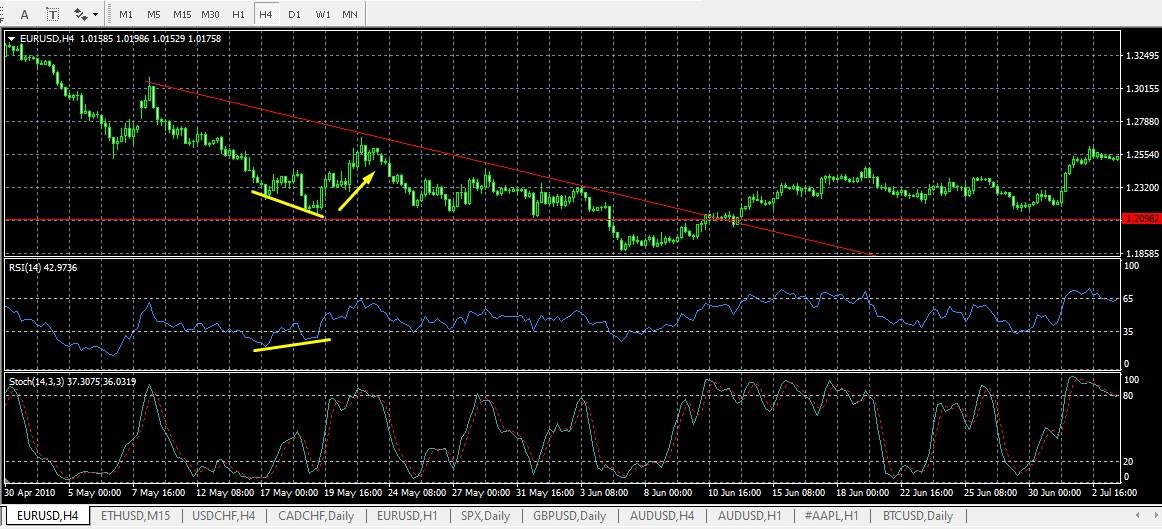
Divergence on the chart
This intermediate screenshot shows a small bullish divergence on a zoomed-in chart. It could be used for a short-term strategy. However, our task is to find a strong long-term signal.
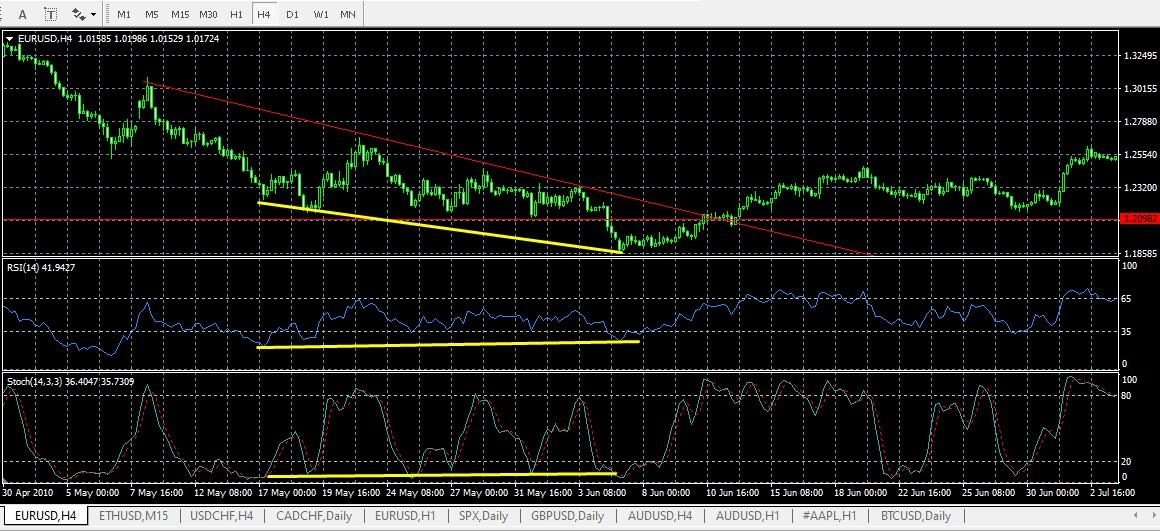
Divergence on the chart
The chart shows an upward RSI movement, insignificant movement of Stochastic and downward price movement. A sign of divergence is seen, but breakout of the Triangle pattern down is the main signal. We open a short position on the next candle after the breakout at point 1 with a Stop on the local high (point 2 on the screenshot below).
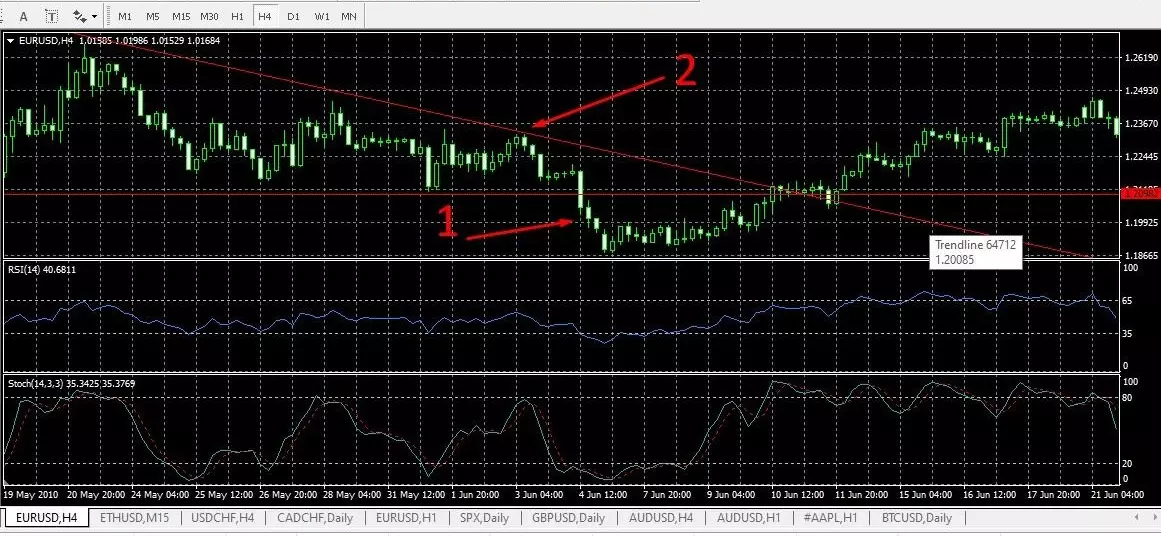
Divergence on the chart
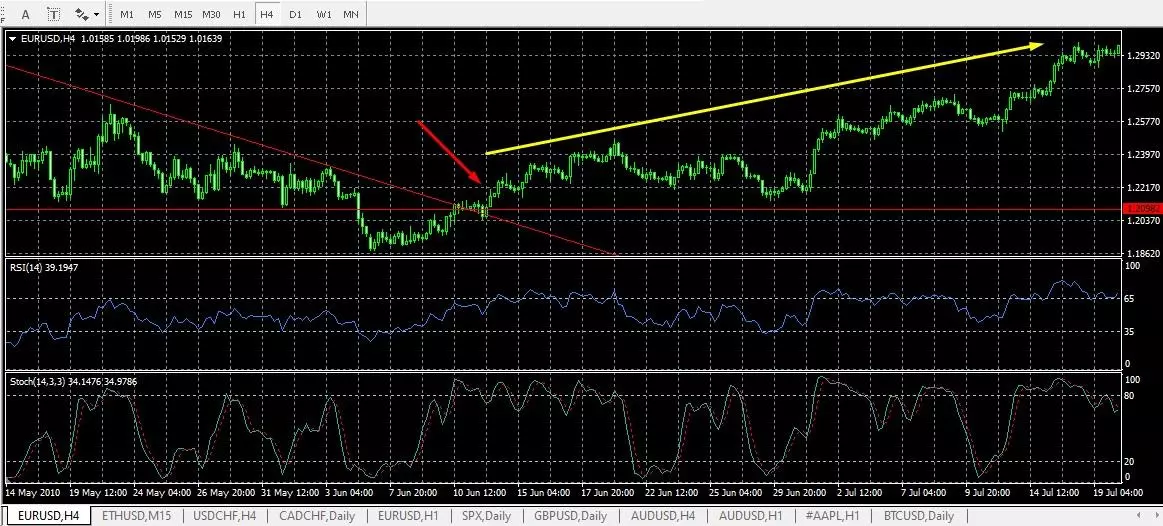
Further development of the situation shows that this trade could have turned out to be unprofitable. The next strong signal is the breakout of the Triangle upward. At this point (the red arrow on the screenshot below), we reverse the position towards the upward movement.
Divergence on the chart
Conclusion on this strategy:
-
Always focus only on main signals. If they strongly contradict the additional signals, make a decision: to risk or not. In this case, the pattern and trend lines are the main signals.
-
RSI and Stochastic are confirming and signaling instruments. Stochastic showed a weak rise, but it can still be called a confirming signal.
-
The signals are not always correct. Triangle breakout down turned out to be false. Divergence turned out to be a stronger signal.
-
Movement of oscillators in the overbought and oversold zones is ignored in long-term strategies.
Also, this example shows that pure RSI divergence is rare. However, even insignificant, visible change of the oscillator extremes with price extremes can give a signal.
Best Brokers 2024


Summary
Things to know about RSI divergence:
-
It is a strong signal that indicates an imminent price reversal towards the indicator line.
-
It is formed from the oscillator’s overbought and oversold zones.
-
It is used for preliminary market analysis or as a signal confirming trend indicator.
-
It works best on the timeframes from H1.
Divergence is a strong confirming signal provided that you learn to quickly see its formation. You can master this skill on a demo account on a reduced scale.
FAQs
Is divergence a strong signal?
It is one of the strongest signals provided that the identified divergence is built in compliance with the basic rules. The location of indicator extremes, the angle of inclination of the indicator line, etc. are important. You need to take into consideration fundamental factors that can disrupt formation of a divergence, or, conversely, accelerate the price reversal in favor of the trader.
Why is it best to use RSI for searching for divergences?
It is one of the most accurate indicators with a clear logic of calculation. Its formula allows you to effectively track potential trend reversal zones. Also, RSI divergence is one of the strongest signals. You can also use the Stochastic, and MACD.
How do I use RSI divergence in trading strategies?
If the indicator shows convergence or divergence of its line with the price, there is a possibility of a price reversal towards the RSI. The moment of reversal is determined by reversal patterns and trend indicators. The continuation of the indicator movement confirms the start of a new trend.
What are the instruments for searching for a divergence?
Possible options:
Visual search. The divergence is determined "by eye" on a reduced scale on H1 timeframes.
Custom indicators. The instruments that show divergences on the chart. They save time and point to short divergences. However, due to redrawing, they can give false signals.
There are software solutions with chart and technical instruments, the package of which includes software for finding divergences. They can be a ready-made trading strategy. Most often they are available on a paid subscription.
Related Articles


Team that worked on the article

Ivan is a financial expert and analyst specializing in Forex, crypto, and stock trading. He prefers conservative trading strategies with low and medium risks, as well as medium-term and long-term investments. He has been working with financial markets for 8 years. Ivan prepares text materials for novice traders. He specializes in reviews and assessment of brokers, analyzing their reliability, trading conditions, and features.

Dr. BJ Johnson is a PhD in English Language and an editor with over 15 years of experience. He earned his degree in English Language in the U.S and the UK. In 2020, Dr. Johnson joined the Traders Union team. Since then, he has created over 100 exclusive articles and edited over 300 articles of other authors.
The topics he covers include trading signals, cryptocurrencies, Forex brokers, stock brokers, expert advisors, binary options. He has also worked on the ratings of brokers and many other materials.
Dr. BJ Johnson’s motto: It always seems impossible until it’s done. You can do it.