How To Use The Alligator Indicator To Catch Real Market Trends


Editorial Note: While we adhere to strict Editorial Integrity, this post may contain references to products from our partners. Here's an explanation for How We Make Money. None of the data and information on this webpage constitutes investment advice according to our Disclaimer.
The Alligator indicator is a trend-following tool that uses three smoothed moving averages to identify market phases like rest, awakening, and active trending. Instead of reacting to crossovers, traders should watch the spacing and flow of the lines to catch moves early. When the lines spread and angle in the same direction, it signals momentum and a strong trend is underway.
Most traders slap the Alligator on their screen and wait for the lines to cross like it is some basic moving average setup. But that is not how this tool works. The Alligator is about getting in based on market rhythm, not signals. When the three lines are tight and overlapping, the market is resting. But when they start to spread and angle with space, that is your heads-up that the move is starting to build. If you focus on the line crossing, you are already late. The edge comes from watching the gap and flow between the lines and knowing when the market’s about to move with intent. In this article, we will take a detailed look into this indicator, discussing its origin, calculation, and top strategies.
Introduction to Alligator indicator

The alligator indicator is a trend-following tool that helps traders spot when a market is trending, when it’s flat, and when a new move may be about to start. It was designed to simplify the process of identifying market direction by using three smoothed moving averages that act like the jaw, teeth, and lips of an alligator.
The indicator is especially useful in filtering out sideways market conditions, where many traders get stuck in false signals. Instead of reacting to every small move, the alligator helps you stay patient until the trend truly begins. It’s best used with a clean chart and in combination with support, resistance, or volume tools.
What the alligator lines represent
Jaw (blue line) Slowest line. Shows the long-term direction and acts like the alligator’s jaw, which moves slowly.
Teeth (red line) Medium-speed line. Reacts faster than the jaw and shows mid-term momentum.
Lips (green line) Fastest line. Tracks the short-term price movement and signals when the alligator is waking up or falling asleep.
When these lines are apart and moving in the same direction, the market is trending. When they’re tangled together, it suggests the market is sleeping or moving sideways.
Origin and development of alligator indicator
The alligator indicator was developed by Bill Williams, a trader and author known for combining technical analysis with psychological concepts. He introduced this indicator as part of his broader trading system that focused on understanding market behavior in phases.
Bill Williams believed that the market moves in cycles (periods of rest followed by periods of action). The alligator was his way of helping traders recognize these phases and avoid entering trades during unproductive, sideways markets.
Why Bill Williams created the indicator
To make trend recognition simpler and more visual.
To help traders avoid losses during flat markets.
To provide a tool that works based on market structure, not prediction.
How it evolved
First introduced in Williams’ book Trading Chaos.
Became a core part of his trading strategy alongside other tools like the Awesome Oscillator and fractals.
Has since become widely used across platforms like MetaTrader, TradingView, and others.
Understanding the components of alligator indicator
The alligator indicator is made up of three moving average lines, each representing a different "part" of the alligator’s mouth. These lines work together to show whether the market is sleeping, waking up, or actively trending. By understanding what each line does, you’ll be able to read the indicator more clearly and time your trades with more confidence.
The three key components
Each line has a purpose. They all use smoothed moving averages but differ in length and shift.
1. Jaw – the blue line
This is the slowest of the three lines.
It is a 13-period smoothed moving average.
Plotted 8 bars into the future (shifted forward).
Represents the alligator’s jaw; slow to move and opens wide when the trend is strong.
What it tells you
Shows the long-term trend direction.
If the jaw is flat and close to other lines, the market is inactive.
When it opens wide and slopes, the market is trending.
2. Teeth – the red line
This is a medium-speed line.
Uses an 8-period smoothed moving average.
Shifted 5 bars forward.
Represents the alligator’s teeth; starts moving earlier than the jaw.
What it tells you
Tracks mid-term price movement.
When it begins to separate from the jaw and lips, the market is waking up.
Acts as a confirmation of early trend signals.
3. Lips – the green line
This is the fastest line in the group.
Uses a 5-period smoothed moving average.
Shifted 3 bars forward.
Represents the alligator’s lips; first to move when the market starts changing.
What it tells you
Shows short-term price direction.
Crosses above or below the teeth and jaw to signal a new trend may be starting.
Gives the earliest visual cue of a potential setup.
How the lines work together
When all three lines are close and twisted together, the alligator is sleeping. This means the market is flat or ranging.
When the lips cross above the teeth and jaw, the alligator is waking up and preparing to eat. This signals the start of a trend.
When all three lines are moving in the same direction and spreading apart, the alligator is eating and a strong trend is underway.
When the lines begin to move closer again, the alligator is full and going back to sleep. This often means the trend is slowing down or ending.
How to set up alligator indicator
The alligator indicator is built into most trading platforms and can be added to your chart in just a few clicks. Once it’s applied, you can tweak a few visual settings or leave it at its default. Knowing how to set it up correctly will help you read the signals more clearly and trade with more confidence.
Access the indicator

Adding the alligator indicator to your chart is fast and straightforward.
How to do it
Open the indicators menu in your charting platform.
Type Williams Alligator in the search bar.
Click to apply it. The line will appear below your main chart in a separate pane.
Where it’s available
Pre-installed on TradingView, MetaTrader 4 and 5, ThinkorSwim, and most other charting tools.
No external downloads or plug-ins are required.
Configure the parameters

While the alligator indicator works well right out of the box, you can customize it to better fit your trading approach or improve visibility on your chart.
Adjustable settings
Jaw (blue line)
- Default: 13-period smoothed moving average, shifted 8 bars forward.
- You can increase the period to track longer-term trends.
Teeth (red line)
- Default: 8-period smoothed moving average, shifted 5 bars forward.
- Slight changes here can help fine-tune mid-trend entries.
Lips (green line)
- Default: 5-period smoothed moving average, shifted 3 bars forward.
- This line reacts the fastest, so any changes will affect your early signals.
Display options
Color and line thickness
- Customize the colors to suit your chart background.
- Make the lines thicker or bolder if you want more visual separation.
Visibility by timeframe
- Some platforms let you choose which time frames to show the indicator on.
- Keep it consistent across your preferred trading intervals for better analysis.
Tips for smoother setup
Stick with default settings when starting out.
Adjust colors for better contrast with your chart theme.
Use in combination with trendlines or support and resistance levels for best results.
Trading strategies using alligator indicator
The alligator indicator is most useful for identifying trends and avoiding sideways markets. With the help of its three smoothed moving average lines, jaw, teeth, and lips, you can build simple but effective strategies that work across multiple timeframes and markets.
Trend breakout strategy
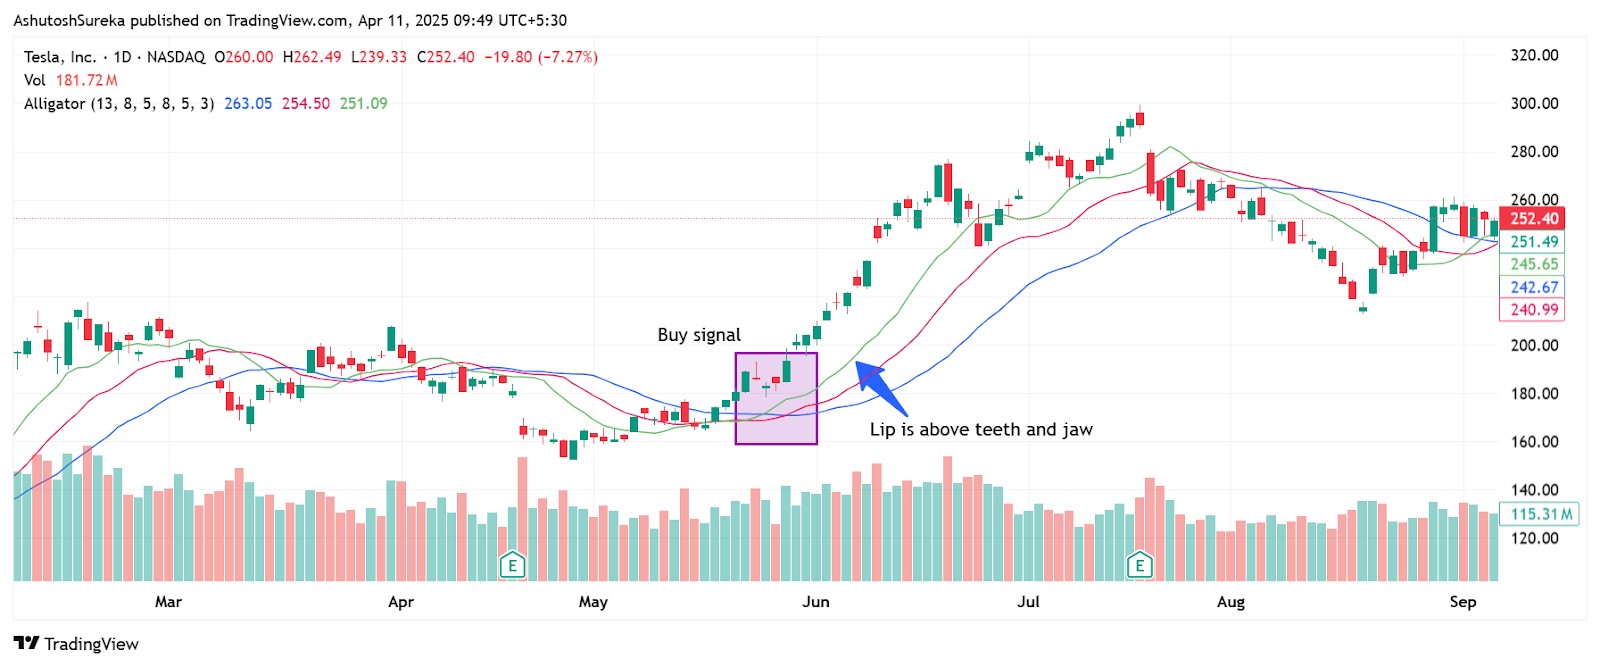
This strategy focuses on catching the beginning of a new trend, right when the alligator “wakes up” and starts to open its mouth.
How to use it
Wait for the three lines (green, red, blue) to move apart and angle in the same direction.
Enter a buy trade if the lips (green) cross above the teeth and jaw and all three lines are pointing upward.
Enter a sell trade if the lips cross below the other two and all are sloping downward.
Set your stop loss just beyond the last consolidation or swing point.
Why this works
The separation of lines shows a new trend is starting.
It filters out flat market periods.
It helps you avoid trading too early.
Trend continuation strategy
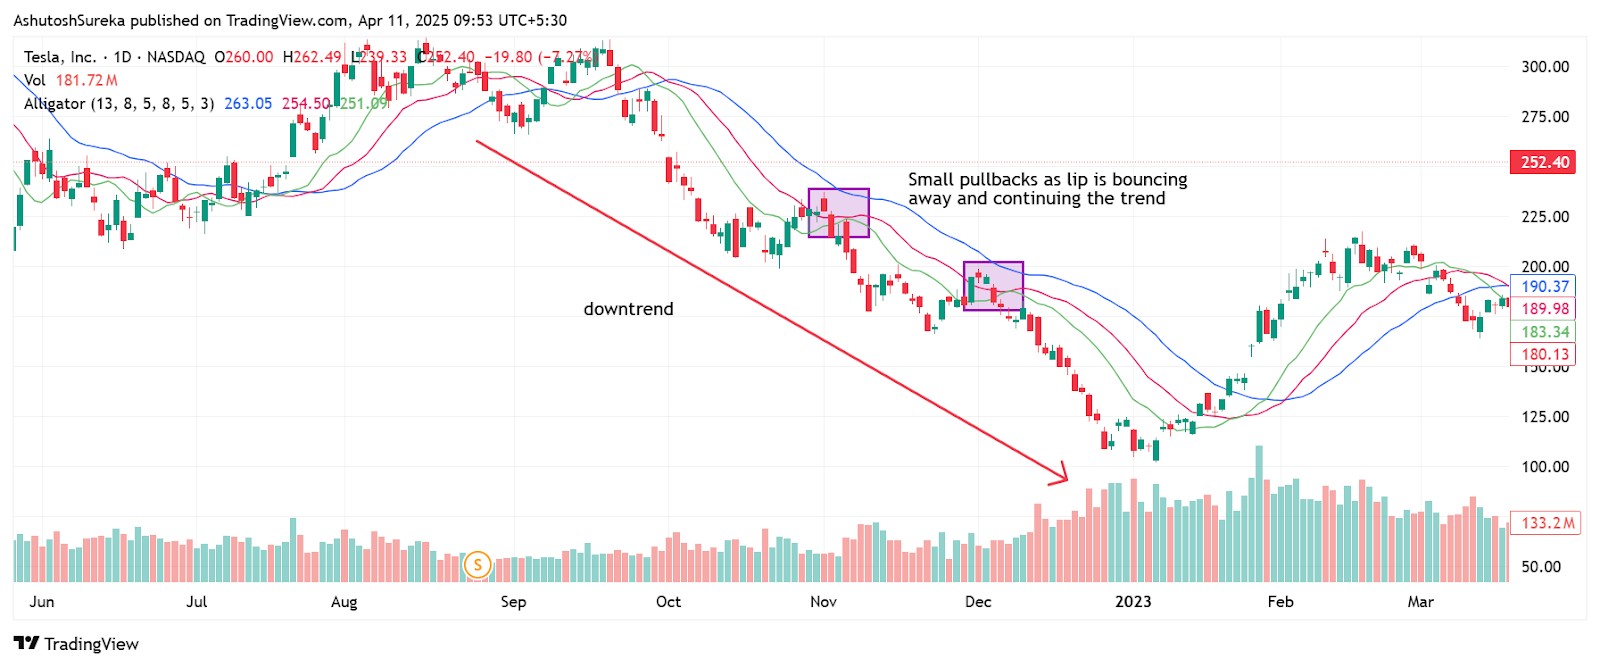
This setup helps you re-enter an existing trend after a small pullback or pause in price.
How to use it
Identify an ongoing trend with the three lines spread apart and moving in the same direction.
Wait for the price to briefly pull back toward the teeth or jaw.
Look for the lips to bounce away and continue in the trend direction.
Enter with the trend and place your stop behind the nearest line or candle low/high.
Why this works
Lets you join a trend without chasing.
Helps time entries during pauses or corrections.
Gives you a simple visual guide to where the trend might resume.
Sleep and wake-up strategy
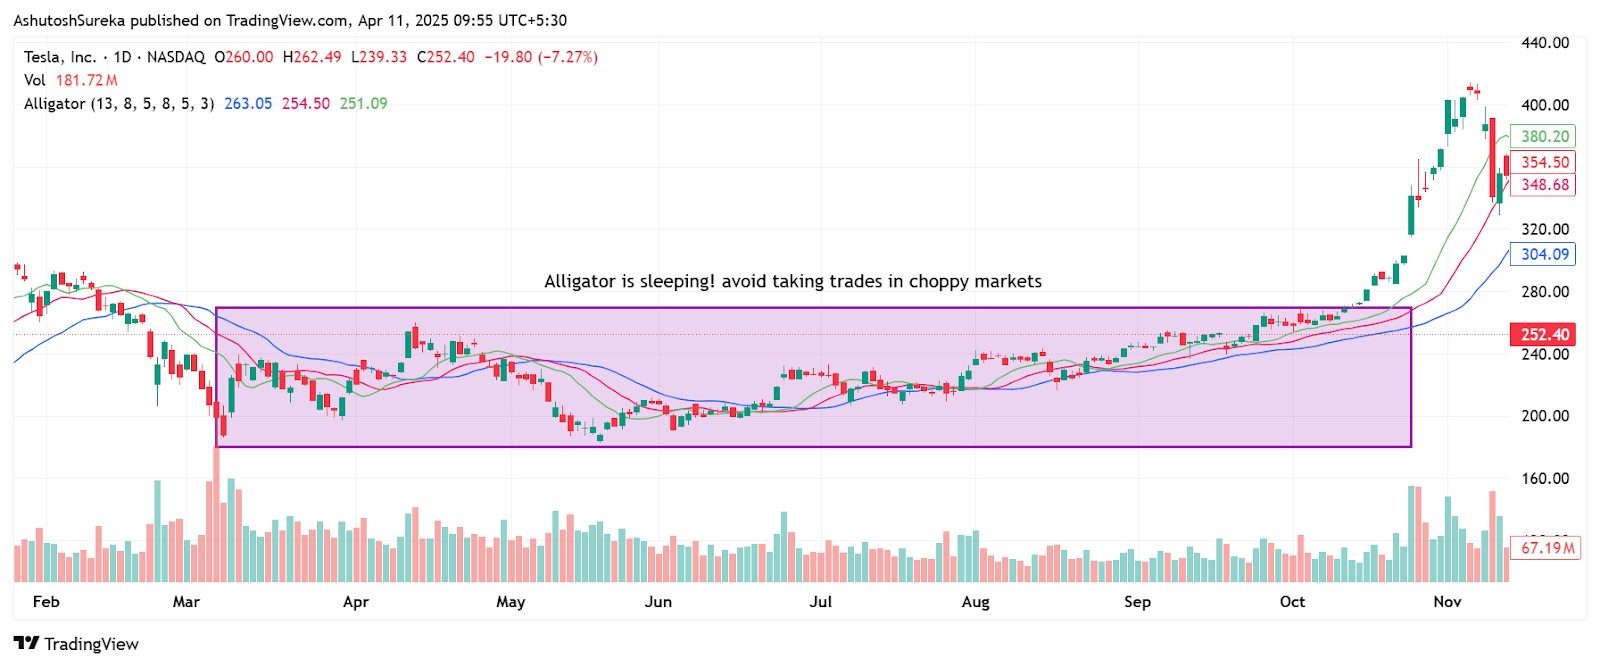
This is a waiting strategy that helps avoid low-probability trades during sideways markets.
How to use it
When all three lines are twisted together and flat, the market is sleeping.
Avoid trading during this time, no clear trend is present.
Wait until the lips (green) cross the teeth and jaw, and the lines begin to separate.
Enter only when there is a clean direction and price breaks out of the range.
Why this works
Keeps you from overtrading in choppy conditions.
Focuses your attention only on meaningful price action.
Helps reduce losses from false breakouts.
If your trading strategy relies heavily on technical indicators, choosing a broker that offers access to platforms like TradingView, MT5, or cTrader can significantly simplify your trading experience. These platforms are equipped with an extensive range of analytical tools, supporting nearly every strategy imaginable. In the table below, you'll find a comparison of the top brokers that provide access to these platforms, helping you select the one that best suits your needs.
| Currency pairs | Crypto | Stocks | Min. deposit, $ | Max. leverage | TradingView | MT5 | cTrader | Regulation | TU overall score | Open an account | |
|---|---|---|---|---|---|---|---|---|---|---|---|
| 70 | Yes | Yes | 100 | 1:500 | No | Yes | Yes | FCA, CYSEC, FSCA, SCB, FSA (Seychelles) | 7.9 | Open an account Your capital is at risk. |
|
| 61 | Yes | Yes | 200 | 1:500 | Yes | Yes | Yes | ASIC, CySEC, and FSA | 7.46 | Open an account Your capital is at risk. |
|
| 50 | Yes | Yes | 5 | 1:30 | Yes | Yes | Yes | MFSA, LFSA, VFSC, BVI FSC, FSC (Mauritius) | 7.2 | Open an account Your capital is at risk. |
|
| 90 | Yes | Yes | 1 | 1:500 | Yes | Yes | Yes | ASIC, VFSC, FSA | 7.19 | Open an account Your capital is at risk. |
|
| 90 | Yes | Yes | No | 1:500 | Yes | Yes | Yes | ASIC, FCA, DFSA, BaFin, CMA, SCB, CySec | 7.17 | Open an account Your capital is at risk.
|
We at Traders Union have analyzed financial markets for over 14 years, evaluating brokers based on 250+ transparent criteria, including security, regulation, and trading conditions. Our expert team of over 50 professionals regularly updates a Watch List of 500+ brokers to provide users with data-driven insights. While our research is based on objective data, we encourage users to perform independent due diligence and consult official regulatory sources before making any financial decisions. Learn more about our methodology and editorial policies.Why trust us
Pros and cons of alligator indicator
The alligator indicator gives traders a visual way to spot when the market is trending and when it’s better to stay out. By using three moving averages with different speeds, it helps filter out market noise and avoid false signals. But like every tool, it has its strong points and its weak spots. Understanding both helps you use it wisely in real trading.
- Pros
- Cons
It gives clean, visual trend confirmation. When the Alligator’s lines spread out and move in one direction, it’s a strong sign the market is trending and worth riding.
It helps you avoid chop. When the lines are tangled, it signals a sideways market, telling you to hold off and wait for clearer conditions.
It fits any trading style or timeframe. Whether you’re scalping or swing trading, the Alligator adjusts well and stays reliable across different chart setups.
It plays well with other indicators. Combine it with support and resistance, volume, or candlestick patterns to boost the accuracy of your entries and exits.
It lags behind fast price moves. Like all moving average-based tools, the Alligator reacts after price has already started moving, so you might miss the initial breakout.
It can send false signals in sideways markets. When the lines briefly separate during choppy price action, it may trick you into entering trades that go nowhere.
It works best with other confirmations. On its own, the Alligator may leave your entries and exits uncertain; pairing it with support, resistance, or volume tools makes signals much clearer.
It demands patience and timing. You’ll need to sit through flat periods without jumping the gun. The indicator only works if you wait for a clean direction.
The Alligator only feeds when volatility aligns with structure

A common thing new traders get wrong with the Alligator is using it without context. Just because the lines start to open does not mean the trend is ready. If there is no real momentum behind the move, the setup has no fuel. The better approach is to wait for the Alligator to tighten while price moves into a range.
Then once the spread happens after a clean breakout from something real, you have a reason to trade. The move needs actual momentum. Without it, the open lines mean nothing.
There is also a small move most traders ignore. Sometimes the Alligator lines open slightly, price makes a push, but then it all fades. If the lines close again and reset, watch that second spread closely. The first move likely pushed out early traders.
The second one often has less noise and more strength. You are not just looking for when the Alligator stretches. You are paying attention to how it reacts after a fake start. That change in how price moves tells you the market is now serious.
Conclusion
The Alligator is not just a tool that finds trends. It helps you feel the pace of the market. If you stop reacting to line crosses and start watching how the lines expand and breathe, you will get a better sense of when the market is taking a break and when it is gearing up for a real move. The goal is not to jump at the first move. It is to see if that move has pressure built underneath. Your cleanest trades will come after the fakeouts, not during them. The Alligator checks how alive the market is. And when it starts to move with purpose, you will already be in sync.
FAQs
How do I trade with the alligator and fractals together?
To trade with the Alligator and fractals, wait for the Alligator lines to open and point in one direction, signaling a trend. Then use a fractal breakout in the same direction as confirmation for entry.
Is the alligator indicator suitable for Forex trading?
Yes, the Alligator indicator is well-suited for Forex trading as it helps identify trending versus ranging markets. It works effectively across multiple timeframes and currency pairs.
Which indicator works best with the alligator indicator?
Fractals, MACD, and RSI often complement the Alligator well. These indicators help confirm trend direction, strength, or potential reversal points, making trade decisions more reliable.
Can you use alligator for short term trading?
Yes, the Alligator can be used for short term trading by applying it to smaller timeframes like 5-minute or 15-minute charts. It helps spot trend beginnings and avoid sideways market traps.
Related Articles
Team that worked on the article
Oleg Tkachenko is an economic analyst and risk manager having more than 14 years of experience in working with systemically important banks, investment companies, and analytical platforms. He has been a Traders Union analyst since 2018. His primary specialties are analysis and prediction of price tendencies in the Forex, stock, commodity, and cryptocurrency markets, as well as the development of trading strategies and individual risk management systems. He also analyzes nonstandard investing markets and studies trading psychology.
Also, Oleg became a member of the National Union of Journalists of Ukraine (membership card No. 4575, international certificate UKR4494).
Chinmay Soni is a financial analyst with more than 5 years of experience in working with stocks, Forex, derivatives, and other assets. As a founder of a boutique research firm and an active researcher, he covers various industries and fields, providing insights backed by statistical data. He is also an educator in the field of finance and technology.
As an author for Traders Union, he contributes his deep analytical insights on various topics, taking into account various aspects.
Mirjan Hipolito is a journalist and news editor at Traders Union. She is an expert crypto writer with five years of experience in the financial markets. Her specialties are daily market news, price predictions, and Initial Coin Offerings (ICO).
Overtrading is a phenomenon where a trader executes too many transactions in the market, surpassing their strategy and trading more frequently than planned. It's a common mistake that can lead to financial losses.
Volatility refers to the degree of variation or fluctuation in the price or value of a financial asset, such as stocks, bonds, or cryptocurrencies, over a period of time. Higher volatility indicates that an asset's price is experiencing more significant and rapid price swings, while lower volatility suggests relatively stable and gradual price movements.
Cryptocurrency is a type of digital or virtual currency that relies on cryptography for security. Unlike traditional currencies issued by governments (fiat currencies), cryptocurrencies operate on decentralized networks, typically based on blockchain technology.
Risk management is a risk management model that involves controlling potential losses while maximizing profits. The main risk management tools are stop loss, take profit, calculation of position volume taking into account leverage and pip value.
Swing trading is a trading strategy that involves holding positions in financial assets, such as stocks or forex, for several days to weeks, aiming to profit from short- to medium-term price swings or "swings" in the market. Swing traders typically use technical and fundamental analysis to identify potential entry and exit points.


-
 Afghanistan
-
 Albania
-
 Algeria
-
 Argentina
-
 Armenia
-
 Australia
-
 Austria
-
 Azerbaijan
-
 Bahamas
-
 Bahrain
-
 Bangladesh
-
 Belgium
-
 Botswana
-
 Brazil
-
 Brunei
-
 Bulgaria
-
 Burma
Burma
-
 Cambodia
-
 Cameroon
-
 Canada
-
 Chile
Chile
-
 China
China
-
 Colombia
-
 Costa Rica
-
 Cote d'Ivoire
-
 Croatia
-
 Cyprus
-
 Czech Republic
-
 Denmark
-
 Dominican Republic
-
 Ecuador
-
 Egypt
Egypt
-
 Estonia
-
 Eswatini
-
 Ethiopia
-
 Finland
-
 France
-
 Georgia
-
 Germany
-
 Ghana
Ghana
-
 Greece
-
 Haiti
Haiti
-
 Hong Kong
-
 Hungary
-
 India
India
-
 Indonesia
-
 Iran, Islamic republic
-
 Iraq
Iraq
-
 Ireland
-
 Israel
-
Italy
-
 Jamaica
-
 Japan
Japan
-
 Jordan
-
 Kazakhstan
-
 Kenya
Kenya
-
 Korea
Korea
-
 Kuwait
-
 Kyrgyzstan
-
 Laos
Laos
-
 Latvia
-
 Lebanon
-
 Libyan Arab Jamahiriya
-
 Lithuania
-
 Luxembourg
-
 Macedonia
-
 Madagascar
-
 Malaysia
-
 Malta
Malta
-
 Mauritius
-
 Mexico
-
 Moldova
-
 Mongolia
-
 Montenegro
-
 Morocco
-
 Mozambique
-
 Namibia
-
 Nepal
Nepal
-
 Netherlands
-
 Nigeria
-
 Norway
-
 Oman
Oman
-
 Pakistan
-
 Palestine
-
 Papua New Guinea
-
 Peru
Peru
-
 Philippines
-
 Poland
-
 Portugal
-
 Puerto Rico
-
 Qatar
Qatar
-
 Romania
-
 Rwanda
-
 Saudi Arabia
-
 Serbia
-
 Singapore
-
 Slovakia
-
 Slovenia
-
 Somalia
-
 South Africa
-
 Spain
Spain
-
 Sri Lanka
-
 Sweden
-
 Switzerland
-
 Syrian Arab Republic
-
 Taiwan
-
 Tajikistan
-
 Tanzania, United Republic Of
-
 Thailand
-
 Trinidad and Tobago
-
 Tunisia
-
 Turkey
-
 UAE
UAE
-
 Uganda
-
 Ukraine
-
 United Kingdom
-
 United States
-
 Uzbekistan
-
 Venezuela
-
 Vietnam
-
 Yemen
Yemen
-
 Zambia
-
 Zimbabwe
- Forex
- Crypto
