Effective Forex Trading Strategies: Looking for a Winner's Way


Editorial Note: While we adhere to strict Editorial Integrity, this post may contain references to products from our partners. Here's an explanation for How We Make Money. None of the data and information on this webpage constitutes investment advice according to our Disclaimer.
Top 5 most effective strategies:
- MA+MACD - Optimal option for trend monitoring
- Support and Resistance Levels - Accurate signals, stable profit
- Bollinger Bands+MACD - Reliable scheme for range trading
- RSI+ADX - Profitable oscillator set
- IchimokuKumo Breakout+ADX - Trend trading with volatility control
You must understand that the stock market does not create additional capital, it simply redistributes the money brought to the trading floors among the participants. And to make money, you must be smarter and faster, and your trading strategies must be more efficient than your competitors.
In Forex trading, optimization of strategies is necessary to improve their effectiveness. Regular updating of trading strategies allows you to adapt to changing market conditions, statistical analysis of results is important for adjusting proven Forex trading methods.
Practical experience further enables the creation of more efficient strategies, ensuring consistent profit in Forex trading. We have tested the main types of strategies and will provide recommendations for their improvement. So let’s begin.
How to assess the effectiveness of a trading strategy
Forex trading tips are given by everyone, but how effective they are you have to check on your deposit. Let us recall the basic statistics in terms of return/risk to assess the suitability of a strategy for real trading.
Profit parameters
Return: Total profit obtained from the strategy during the testing period. The more the better.
NetProfit/NetLoss (NP): The ratio of profit and loss (for the estimated period) to the amount of the initial deposit (in $ or %). Influence on the real evaluation of efficiency is weak.
Profit Factor (PF): Ratio of total profits to total losses. It does not depend on capital size, leverage, commissions and other conditions. The impact of this parameter on the overall result is very strong.
Win Rate: The percentage of profitable deals out of the total number of deals. The Impact on the overall score is weak.
Average Win/Loss: Average profit and loss per 1 deal.
Largest Winning/Losing Trade (LW/LT): Max profit and max loss.
Risk parameters
Drawdown (DD, current, fixed, max, relative): Max difference between the local max and the subsequent minimum of the capital state. The very strong impact.
Profit to Risk Ratio: Ratio between expected profit and maximum drawdown.
Loading Deposit: The ratio of the amount of collateral on open positions to the amount of funds (in %). The strong impact.
Max Consecutive Winners/ConsecutiveLosers: The potential sustainability of the strategy. Used in conjunction with drawdown values. Only relevant for Martingale based systems.
Stability parameters
Sharpe Ratio: The ratio of return/risk. The very strong impact.
Restoration Factor (RF): Shows how quickly the deposit has recovered after a loss. The medium impact.
Calmar Ratio: Probability of profit in relation to the probability of losses. The impact is weak.
Sortino Ratio: Profitability of trading per unit of risk.
Test of popular strategies of different types
In the real market, a trader uses a rather limited set of instruments and market rules to make trading decisions, and tries to maximize profit by searching for optimal parameters. Testing Forex strategies remains the primary method of any optimization. Today every trading terminal contains a built-in strategy tester and at any moment you can get the minimum necessary statistics.
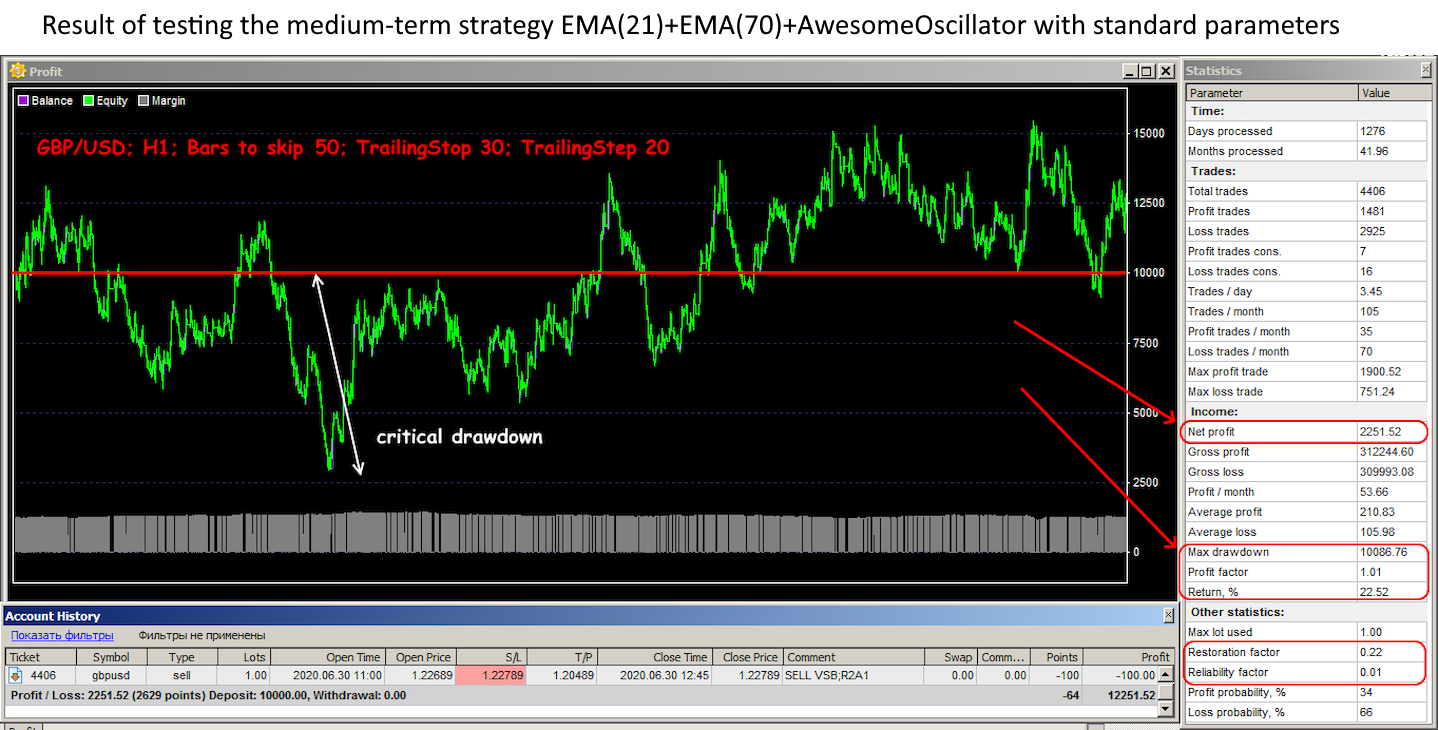
 Strategy test: an example of a report from MetaTrader 4(5)
To make a trading decision, a trader has only the parameters of price and trading volume of the asset, and time, of course. All technical operators work with the same set of data. For more details on testing methods - see FAQs.
 ForexTester: efficiency check
We offer the results of testing strategies in which the factors of technical analysis are considered to be prioritized. Trading systems may have different names, use several indicators, allow variation of parameters and create complex indicators, but in reality they use several standard tools.
 ForexTester: searching for the best option
We set the task to evaluate the statistical efficiency of the main types of strategies on fairly recent price data (3 years) and focused only on standard indicators that directly affect the formation of a trading signal and the execution of deals.
For each group we selected five most popular trading systems and performed Backtesting on historical price data for the period from 01.05.2021 to 01.05.2024 using special software ForexTester.
So:
Initial deposit $10000, timeframe: for market entry - H1, for deal support - H4. Tests were performed on EUR/USD (major), EUR/JPY (cross) and XTI/USD (spot WTI oil asset). The risk is average, the maximum load on the deposit is not more than 40%. For each strategy the average values of tests on three assets are given. The results in the table are sorted by ProfitFactor. The efficiency of strategies is evaluated taking into account the values of Profit Factor, Max Drawdown, Total Return.
Trend strategies
| Strategy | Total, % | Mont, % | Max Drwdwn, % | Win Rate | Avrg Win, $ | Avrg Loss $ | Sharpe Ratio | Profit Factor |
|---|---|---|---|---|---|---|---|---|
MA+MACD | 140 | 3,89 | 42 | 58 | 180 | 90 | 0,97 | 2,76 |
Heiken Ashi exit with MA | 80 | 2,22 | 40 | 63 | 105 | 100 | 1,37 | 1,79 |
Moving Avrg Crossover | 138 | 3,83 | 24 | 65 | 120 | 170 | 1,60 | 1,31 |
Bollinger Bands+AO | 125 | 3,47 | 48 | -51 | 110 | 95 | 0,65 | 1,21 |
Alligator +AO | 110 | 3,06 | 33 | 52 | 105 | 110 | 1,43 | 1,03 |
Result: Forex trading strategies for beginners, based on classical moving and hybrid trend oscillators, turned out to be both the most profitable and the most stable. Note: Heiken Ashi + MA has a high Sharpe ratio, but as a result showed a weak profit.
Counter-trend strategies
| Strategy | Total, % | Mont, % | Max Drwdwn, % | Win Rate | Avrg Win, $ | Avrg Loss $ | Sharpe Ratio | Profit Factor |
|---|---|---|---|---|---|---|---|---|
Support and Resistance Levels | 72 | 2,00 | 37 | 55 | 168 | 90 | 1,64 | 2,28 |
Parabolic SAR | 120 | 3,33 | 38 | 48 | 210 | 90 | 1,24 | 2,15 |
MACD Divergence | 135 | 3,75 | 43 | 57 | 130 | 95 | 0,93 | 1,81 |
Stochastic + Bollinger Bands | 75 | 2,08 | 49 | 51 | 92 | 90 | 0,50 | 1,06 |
MACD + ADX | 105 | 2,92 | 52 | 48 | 78 | 95 | 0,52 | 0,76 |
Result: All variants allowed too serious drawdown. Despite the high Sharpe ratio, the leader of the list showed a weak profit. MACD Divergence is more trustworthy - simple and reliable.
Range trading strategies
| Strategy | Total, % | Mont, % | Max Drwdwn, % | Win Rate | Avrg Win, $ | Avrg Loss $ | Sharpe Ratio | Profit Factor |
|---|---|---|---|---|---|---|---|---|
Bollinger Bands + MACD | 72 | 2,00 | 44 | 55 | 210 | 90 | 0,69 | 2,85 |
Keltner Channel + MACD | 140 | 3,89 | 33 | 51 | 220 | 95 | 1,59 | 2,41 |
Donchian Channel + ADX | 105 | 2,92 | 57 | 48 | 230 | 100 | 0,70 | 2,12 |
Keltner Channel + Stochastic Oscillator | 130 | 3,61 | 32 | 42 | 200 | 85 | 1,70 | 1,70 |
Price Channel + Volume | 125 | 3,47 | 40 | 41 | 195 | 90 | 1,47 | 1,51 |
Result: Once again, the Sharpe ratio lets us down - the profitability of the leader is quite weak. And the value is too high. The Keltner Channel + MACD variant looks the most balanced, although the maximum drawdown of 33% does not inspire confidence. Usually such schemes regularly "fail" by 40-50%.
Complex systems using oscillators
| Strategy | Total, % | Mont, % | Max Drwdwn, % | Win Rate | Avrg Win, $ | Avrg Loss $ | Sharpe Ratio | Profit Factor |
|---|---|---|---|---|---|---|---|---|
RSI + ADX | 110 | 3,06 | 39 | 51 | 250 | 105 | 1,01 | 2,48 |
Stochastic + MACD | 105 | 2,92 | 28 | 44 | 205 | 90 | 1,21 | 1,79 |
CCI + Moving Avrg | 70 | 1,94 | 51 | 43 | 190 | 90 | 1,57 | 1,59 |
Williams %R + RSI | 85 | 2,36 | 40 | 48 | 120 | 85 | 1,73 | 1,30 |
RSI + Moving Avrg | 90 | 2,50 | 52 | 42 | 110 | 85 | 1,51 | 0,94 |
Result: Strategies that are based only on oscillators, most often, are not viable, but if we take into account that RSI perfectly controls overbought/oversold, and ADX monitors volatility, such a combination may well be profitable.
Trading systems with the Ichimoku Indicator
| Strategy | Total, % | Mont, % | Max Drwdwn, % | Win Rate | Avrg Win, $ | Avrg Loss $ | Sharpe Ratio | Profit Factor |
|---|---|---|---|---|---|---|---|---|
Ichimoku Qumo Breakout + ADX | 80 | 2,22 | 22 | 55 | 225 | 95 | 1,27 | 2,89 |
Ichimoku Complete System + Volume Profile | 80 | 2,22 | 41 | 42 | 240 | 95 | 0,57 | 1,83 |
Ichimoku Chinkou Span + Stochastic | 92 | 2,56 | 39 | 47 | 170 | 90 | 1,01 | 1,68 |
Ichimoku - Kumo Breakout + MACD | 90 | 2,50 | 28 | 55 | 230 | 170 | 1,29 | 1,65 |
Ichimoku - Tenkan/Kijun Cross + RSI | 95 | 2,64 | 22 | 64 | 120 | 195 | 1,78 | 1,09 |
Result: Kumo cloud is considered to be the most accurate and strongest Ishimoku trend zone, and when its boundaries are broken, the ADX indicator will show how much the market is interested in a particular direction. Quite a natural leader.
Systems using volume indicators
| Strategy | Total, % | Mont, % | Max Drwdwn, % | Win Rate | Avrg Win, $ | Avrg Loss $ | Sharpe Ratio | Profit Factor |
|---|---|---|---|---|---|---|---|---|
Volume + Moving Avrg | 110 | 3,06 | 38 | 51 | 210 | 85 | 1,19 | 2,57 |
Accumulation/Distribution + Stochastic | 92 | 2,56 | 22 | 49 | 185 | 85 | 1,74 | 2,09 |
Chaikin Money Flow + ADX | 82 | 2,28 | 29 | 44 | 215 | 90 | 1,55 | 1,88 |
Volume + MACD | 140 | 3,89 | 49 | 44 | 220 | 95 | 0,70 | 1,82 |
OBV (On-Balance Volume) + Bollinger Bands | 90 | 2,50 | 51 | 32 | 195 | 90 | 0,87 | 1,02 |
Result: These indicators use tick volume data, so the reliability of their trading signals is weak. But when combined with the moving average, it turns out to be quite a working scheme.
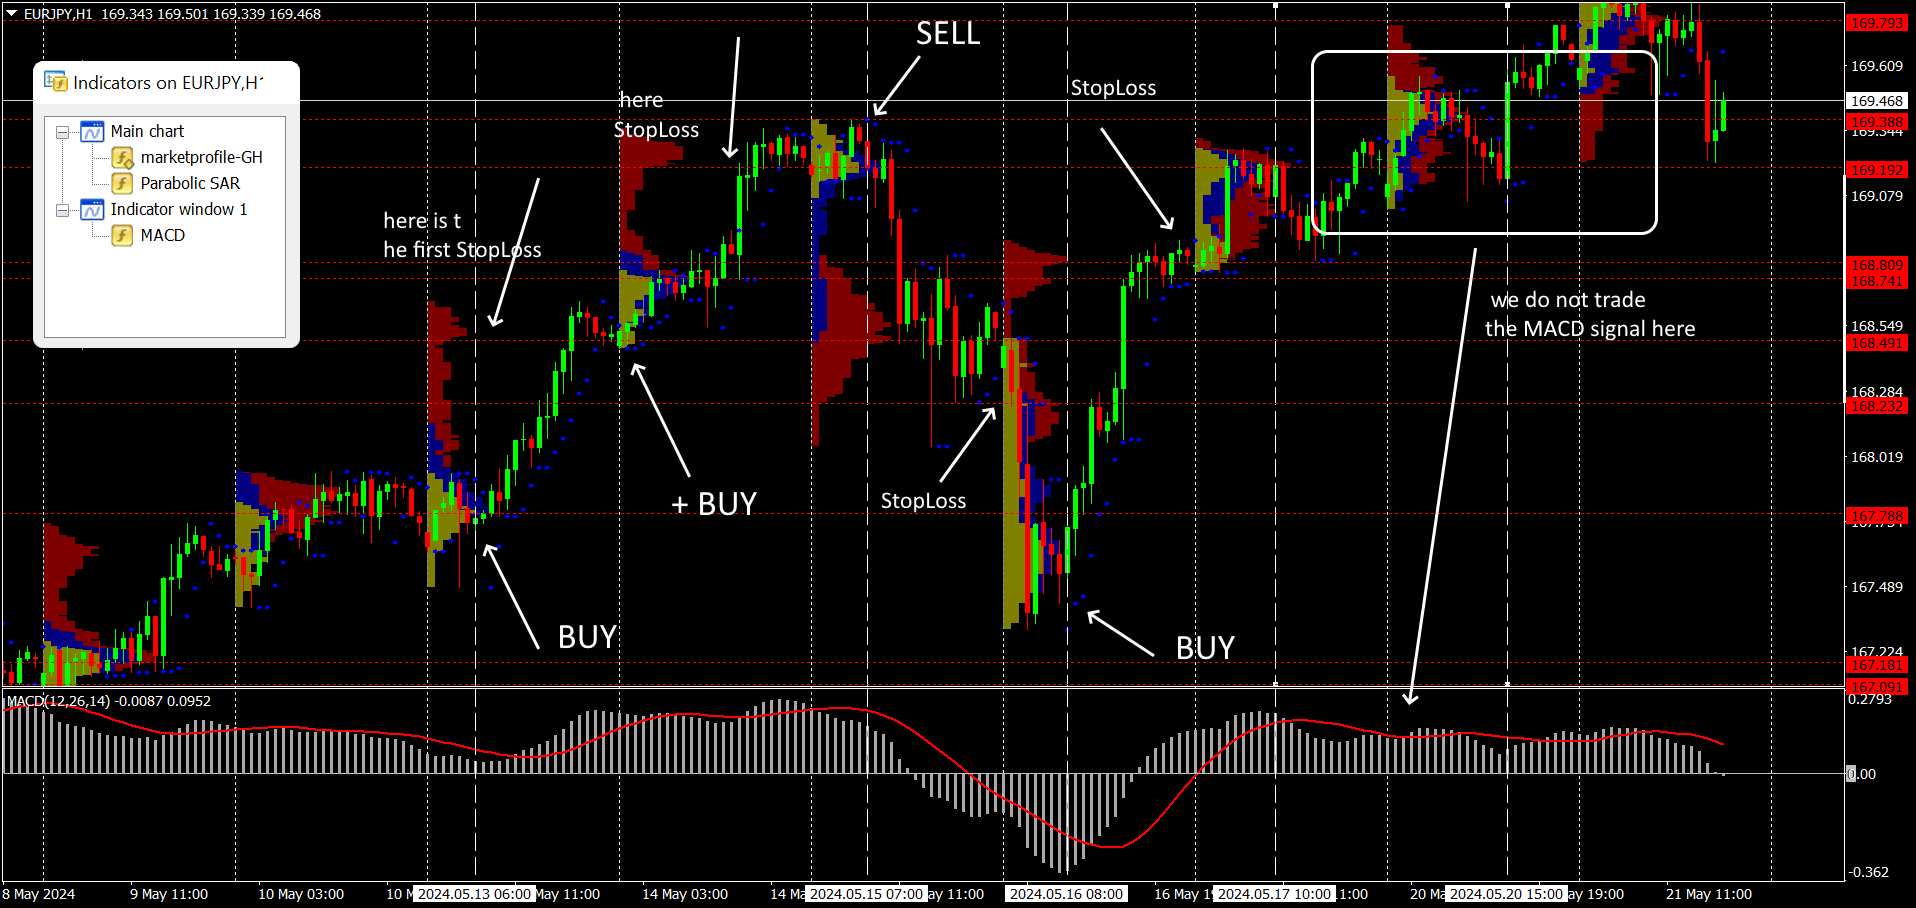
Market profile analysis systems
| Strategy | Total, % | Mont, % | Max Drwdwn, % | Win Rate | Avrg Win, $ | Avrg Loss $ | Sharpe Ratio | Profit Factor |
|---|---|---|---|---|---|---|---|---|
Market Profile + MACD | 157 | 4,36 | 12 | 51 | 230 | 90 | 1,62 | 2,66 |
Market Profile + Moving Avrg | 132 | 3,67 | 22 | 44 | 220 | 85 | 1,39 | 2,03 |
Market Profile + Parabolic SAR | 110 | 3,06 | 29 | 45 | 210 | 90 | 1,69 | 1,91 |
Market Profile + Ichimoku Kinko Hyo | 130 | 3,61 | 31 | 37 | 230 | 100 | 1,44 | 1,35 |
Market Profile + ADX | 90 | 2,50 | 28 | 42 | 102 | 95 | 1,37 | 0,78 |
Result: Use of the Market Profile indicator assumes that data on real trading volumes (at least from large exchanges!) comes directly to the terminal. This may be inaccessible for beginners, but it is something worth striving for. Analyzing such data really increases the efficiency of any strategy.
Strategies based on Harmonic Patterns
| Strategy | Total, % | Mont, % | Max Drwdwn, % | Win Rate | Avrg Win, $ | Avrg Loss $ | Sharpe Ratio | Profit Factor |
|---|---|---|---|---|---|---|---|---|
Gartley Butterfly + MACD | 130 | 3,61 | 26 | 49 | 210 | 85 | 1,80 | 2,37 |
Gartley Butterfly + Volume Profile | 135 | 3,75 | 37 | 48 | 205 | 92 | 1,44 | 2,06 |
Gartley Butterfly + ADX | 110 | 3,06 | 40 | 42 | 215 | 90 | 1,48 | 1,73 |
Gartley Butterfly + RSI | 90 | 2,50 | 42 | 41 | 220 | 95 | 1,00 | 1,61 |
Gartley Butterfly + Stochastic Oscillator | 80 | 2,22 | 22 | 48 | 130 | 90 | 1,53 | 1,33 |
Result: Harmonic patterns in combination with the standard MACD always give excellent results. Charting can be done automatically, for example, using the Autochartist service.
Systems based on Candlestick Patterns
| Strategy | Total, % | Mont, % | Max Drwdwn, % | Win Rate | Avrg Win, $ | Avrg Loss $ | Sharpe Ratio | Profit Factor |
|---|---|---|---|---|---|---|---|---|
Doji + Stochastic Oscillator | 125 | 3,47 | 44 | 55 | 178 | 85 | 1,29 | 2,56 |
Doji + Volume Profile | 140 | 3,89 | 22 | 58 | 270 | 150 | 1,16 | 2,49 |
Morning Star + Bollinger Bands | 135 | 3,75 | 51 | 44 | 210 | 90 | 1,08 | 1,83 |
Engulfing Pattern + MACD | 130 | 3,61 | 33 | 37 | 200 | 95 | 1,48 | 1,24 |
Bullish Harami + Moving Avrg | 120 | 3,33 | 49 | 32 | 130 | 85 | 1,22 | 0,72 |
Result: The test once again showed that Dodji is the most effective candlestick pattern. Schemes of several patterns give a less stable signal.
Strategies on Price Action Patterns
| Strategy | Total, % | Mont, % | Max Drwdwn, % | Win Rate | Avrg Win, $ | Avrg Loss $ | Sharpe Ratio | Profit Factor |
|---|---|---|---|---|---|---|---|---|
Pin Bar + Moving Avrg | 130 | 3,61 | 44 | 53 | 200 | 85 | 0,68 | 2,65 |
Inside Bar | 125 | 3,47 | 22 | 52 | 190 | 90 | 1,73 | 2,29 |
Inside Bar + Bollinger Bands | 135 | 3,75 | 39 | 47 | 210 | 90 | 1,11 | 2,07 |
Three Bar Reversal | 125 | 3,47 | 38 | 44 | 195 | 90 | 1,19 | 1,70 |
Engulfing Bar + MACD | 140 | 3,89 | 51 | 32 | 210 | 90 | 0,71 | 1,10 |
Result: The single PinBar has also proven to be stronger than its peers; bundled with any trend indicator, it will always be the most effective. But the real drawdown in such schemes can be more than 50%, which increases the risk considerably.
How to improve trading strategy?
Let's analyze our "optimal" strategy options by a combination of factors and criteria
| MA+MACD | Support and Resistance Levels | Bollinger Bands + MACD | RSI + ADX | IchimokuKumo Breakout + ADX | Volume + Moving Average | Market Profile + MACD | Gartley Butterfly + MACD | Doji + Stochastic Oscillator | Pin Bar + Moving Average | |
|---|---|---|---|---|---|---|---|---|---|---|
Total Return, % | 140 | 72 | 72 | 110 | 80 | 110 | 157 | 130 | 125 | 130 |
Maximum Drawdown, % | 42 | 37 | 44 | 39 | 22 | 38 | 12 | 26 | 44 | 44 |
Sharpe Ratio | 0,97 | 1,64 | 0,69 | 1,01 | 1,27 | 1,19 | 1,62 | 1,80 | 1,29 | 0,68 |
Profit Factor | 2,76 | 2,28 | 2,85 | 2,48 | 2,89 | 2,57 | 2,66 | 2,37 | 2,56 | 2,65 |
Analysis Summary
Best Total Return: Market Profile + MACD (157%)
Lowest Maximum Drawdown: Market Profile + MACD (12%)
Highest Sharpe Ratio: Gartley Butterfly + MACD (1.80)
Highest Profit Factor: Ichimoku Kumo Breakout + ADX (2.89)
Based on the criteria:
Overall Best Strategy: Market Profile + MACD
This strategy has the highest total return (157%), the lowest maximum drawdown (12%), a high Sharpe ratio (1.62), and a competitive profit factor (2.66).Runner Up: Gartley Butterfly + MACD
This strategy has a high total return (130%), low drawdown (26%), the highest Sharpe ratio (1.80), and a competitive profit factor (2.37).
The "Market Profile + MACD" strategy appears to be the most effective based on the combined factors of Total Return, Maximum Drawdown, Sharpe Ratio, and Profit Factor. The "Gartley Butterfly + MACD" also performs well, particularly with the highest Sharpe Ratio.
What should the Sharpe ratio be?
The value can vary depending on context, asset type and market. However, there are general guidelines that can help you evaluate the effectiveness of an investment strategy:
A range of 0 to 1: A low return compared to its risk. Even if a strategy with this score produces a return, it is still unstable and too risky.
Sharpe Ratio = 1: The strategy has excess return equal to its risk. This is the baseline - the strategy compensates for risk, but does not generate serious profits. Usually achieved in moderately aggressive strategies, but few profitable systems.
Range 1 to 2: The strategy generates more profitability than the level of risk. This is a positive but weak indicator.
Sharpe Ratio > 2: The strategy has stable returns compared to risk. It is often found in well-managed trading systems and investment portfolios. For large hedge funds, a value of 1.8 to 2.4 is considered the norm. Systems that show such a Sharpe ratio during testing can be used on assets with any volatility - they will be profitable even if the real value of this parameter will be lower than the calculated one by 30-40%.
Sharpe Ratio > 3: An abnormally high ratio indicates not so much effective risk management as high, but, more often than not, unstable returns. In Forex, this is quite common in aggressive scalping strategies (e.g. crypto), but such deposits do not last long in the market.
Factors affecting the optimality of the Sharpe ratio:
Market conditions: During periods of high volatility, the Sharpe ratio may decrease as the standard deviation of returns increases.
Asset type: For different asset classes, the optimal Sharpe ratio may differ. For example, for stocks, a Sharpe ratio above 1.0 is considered good, while for bonds, the optimal ratio may be lower.
Investment Objectives: Depending on the investor's objectives (capital growth, capital preservation, return, etc.), the optimal Sharpe ratio may vary.
Broker and profit: Is there a correlation?
Stability and profitability depend not only on the strategy itself, but also on your main market partner - the broker. We remind you: a serious broker is:
Speed of order execution: If a broker delays the execution of orders or executes them at an unfavorable price (slippage), it significantly reduces the profitability of any strategy.
Transparency and honesty: Unreliable brokers manipulate quotes, use hidden commissions and mislead traders about trading conditions. This can lead to unexpected losses and reduce the overall profitability of the strategy.
Safety of funds: A reliable broker guarantees the safety of the client's funds, uses segregated accounts, and does not use the client's money even in a bankruptcy situation.
Quality technical support and trading software: Unprofessional technical support and a problematic trading platform will make any strategy unprofitable.
Regulation and licensing: Regulated brokers must comply with strict standards and regulations, which provides additional protection for traders and reduces the risk of fraud.
Quality of analysis and data: Access to accurate data and analytical tools helps traders make informed decisions and improves the quality of market analysis.
We suggest looking for a reliable broker here:
| Regulation | Investor protection | ECN | Withdrawal fee, % | Trading platform | Trading bots (EAs) | Scalping | Copy trading | Open account | |
|---|---|---|---|---|---|---|---|---|---|
| FCA, CySEC, MAS, ASIC, FMA, FSA (Seychelles) | €20,000 £85,000 SGD 75,000 | Yes | No | Mobile, Web, Desktop | Yes | Yes | No | Open an account Your capital is at risk. |
|
| ASIC, FCA, DFSA, BaFin, CMA, SCB, CySec | £85,000 €20,000 €100,000 (DE) | Yes | No | MT4, MobileTrading, WebTrader, cTrader, MT5, TradingView | Yes | Yes | Yes | Open an account Your capital is at risk.
|
|
| FSC (BVI), ASIC, IIROC, FCA, CFTC, NFA | £85,000 SGD 75,000 $500,000 | Yes | No | WebTrader, MetaTrader4, Mobile platforms, MetaTrader5 | Yes | Yes | Yes | Open an account Your capital is at risk. |
|
| CIMA, FCA, FSA (Japan), NFA, IIROC, ASIC, CFTC | £85,000 | Yes | No | FOREX.com, MT4, MT5 | Yes | Yes | Yes | Study review | |
| SEC, FINRA, SIPC, FCA, NSE, BSE, SEBI, SEHK, HKFE, IIROC, ASIC, CFTC, NFA | $500,000 £85,000 | Yes | Yes | Trader Workstation, IBKR Mobile, APIs | Yes | Yes | No | Open an account Your capital is at risk. |
What needs to be done to make the strategy more effective?
Here are some key steps and tips to improve your strategy:
Analysis and optimization: regularly study your results and adapt your strategy to real market conditions. You need to know exactly where and why your deal did not make a profit.
Backtesting and Forward Testing: Test your strategy on historical data to evaluate its performance and identify weaknesses. Be sure to test the strategy in real time on a demo account before using it on real capital.
Optimize risk control: according to current trading and financial conditions.
Diversification: spread your risks by using different assets and strategies.
Professional and compulsory fundamental analysis.
Application of modern technical analysis tools.
Reasonable use of trading automation tools.
Psychological stability and trading discipline.
Optimization schemes for each technique are chosen individually, but usually adding an additional indicator of a different type, such as chart patterns or PriceAction schemes, greatly simplifies the task of parameter selection. Let's try to add efficiency to a strategy that showed optimal results in a trial test. The system has a trend indicator, a volume indicator too, let's try to add a reversal Parabolic SAR for additional correction of the market entry point.
Result:
| Total Return, % | Monthly Return, % | Maximum Drawdown, % | Win Rate | Average Win, $ | Average Loss $ | Sharpe Ratio | Profit Factor | |
|---|---|---|---|---|---|---|---|---|
Market Profile + MACD | 157 | 4,36 | 12 | 51 | 230 | 90 | 1,62 | 2,66 |
Market Profile + MACD + Parabolic SAR | 315 | 8,75 | 11 | 44 | 685 | 217 | 1,32 | 2,48 |
Result: It can be considered that the performance has improved, but below expectations. I wanted to reduce the drawdown, but it still turned out to be at the critical level. On the other hand, the profitability has grown significantly, despite a slight decrease in the Sharpe ratio. This strategy can be put to test on real data.
Find the best way: Expert opinion

Improving your trading strategy is an integral part of successful trading in the financial markets. Markets are constantly changing due to economic, political, technological and other factors. Advanced Forex trading strategies that were successful in one market cycle may lose their effectiveness in another.
In addition, algorithms, technology and market rules are constantly evolving. Regular review and adjustment of strategy helps to maintain competitive advantage, remain actual and minimize risks.
Improving the effectiveness of your trading strategy is a multifaceted process that involves optimizing various aspects of your trading.
An effective trading strategy should provide a stable income with a reasonable level of risk, rather than a maximum but random profit. The strategy should have a positive Return to Risk Ratio - this means that potential profits should significantly exceed possible losses.
By following these tips, you can significantly improve the performance of your strategy and increase your chances of successful trading.
Conclusion
There are no perfect strategies with 100% profitability on the financial market and there will never be. It is the result of other people's mistakes and ineffective strategies that you get as a result of your deals in the form of profit.
Real successful Forex trading strategies can not be bought, downloaded online, received as a gift, or for example, stolen. A trading methodology should take into account the trader's individual characteristics, and this is not only risk tolerance or capital size, but also personality psychotype, technical capabilities, comfortable trading time.
Improving the effectiveness of a trading strategy requires a comprehensive approach that includes strategy analysis and optimization, risk management, use of technical and fundamental analysis, automation, psychological preparation, constant monitoring and adaptation to market conditions. By following these tips, you can significantly improve the performance of your strategy and increase your chances of successful trading.
You should be prepared for the fact that the values calculated during the test will differ from the real results, sometimes significantly, as no indicator can take into account the uncertainty of the financial market. So, all indicators of trading strategy efficiency must have a solid "safety margin".
Profits to y’all!
FAQs
What is Backtesting?
Testing the effectiveness of a strategy on historical data: selecting a period of historical data, applying the trading strategy to the selected period and analyzing the results (profit/loss, number of deals, drawdowns, etc.).
What is Forward Testing?
This is a test on real data: opening a demo account, applying the strategy in real time, comparing results with expectations. Example: Running a strategy on a demo account for a month and tracking its effectiveness. Comparing the results with historical tests.
What is Monte Carlo simulation?
This is a test on random data: generating a set of random scenarios of market conditions, applying a strategy to each scenario, analyzing the distribution of results. Example: Creating 1000 different scenarios of market behavior and testing how the trading system performs in each scenario. This allows you to evaluate how the strategy handles market volatility.
What is Walk-Forward Analysis?
This is a test on several consecutive periods: splitting historical data into several periods, training a strategy on one period and testing it on the next, repeating the process over the entire time period. Example: Dividing data into 10 one-year intervals. Training the strategy on the first 9 years and testing on the 10th. Then shift one year forward and repeat the process.
Related Articles
Team that worked on the article
Andrey Mastykin is an experienced author, editor, and content strategist who has been with Traders Union since 2020. As an editor, he is meticulous about fact-checking and ensuring the accuracy of all information published on the Traders Union platform. Andrey focuses on educating readers about the potential rewards and risks involved in trading financial markets.
He firmly believes that passive investing is a more suitable strategy for most individuals. Andrey's conservative approach and focus on risk management resonate with many readers, making him a trusted source of financial information.
Also, Andrey is a member of the National Union of Journalists of Ukraine (membership card No. 4574, international certificate UKR4492).
Dr. BJ Johnson is a PhD in English Language and an editor with over 15 years of experience. He earned his degree in English Language in the U.S and the UK. In 2020, Dr. Johnson joined the Traders Union team. Since then, he has created over 100 exclusive articles and edited over 300 articles of other authors.
Mirjan Hipolito is a journalist and news editor at Traders Union. She is an expert crypto writer with five years of experience in the financial markets. Her specialties are daily market news, price predictions, and Initial Coin Offerings (ICO).
Forex trading, short for foreign exchange trading, is the practice of buying and selling currencies in the global foreign exchange market with the aim of profiting from fluctuations in exchange rates. Traders speculate on whether one currency will rise or fall in value relative to another currency and make trading decisions accordingly. However, beware that trading carries risks, and you can lose your whole capital.
Copy trading is an investing tactic where traders replicate the trading strategies of more experienced traders, automatically mirroring their trades in their own accounts to potentially achieve similar results.
Backtesting is the process of testing a trading strategy on historical data. It allows you to evaluate the strategy's performance in the past and identify its potential risks and benefits.
A trading system is a set of rules and algorithms that a trader uses to make trading decisions. It can be based on fundamental analysis, technical analysis, or a combination of both.
ADX (Average Directional Index) is a technical indicator used in financial analysis to measure the strength and momentum of a price trend. It quantifies the degree of trendiness in a market, with higher ADX values indicating stronger trends and lower values suggesting weaker trends.

-
 Afghanistan
-
 Albania
-
 Algeria
-
 Argentina
-
 Armenia
-
 Australia
-
 Austria
-
 Azerbaijan
-
 Bahamas
-
 Bahrain
-
 Bangladesh
-
 Belgium
-
 Botswana
-
 Brazil
-
 Brunei
-
 Bulgaria
-
 Burma
Burma
-
 Cambodia
-
 Cameroon
-
 Canada
-
 Chile
Chile
-
 China
China
-
 Colombia
-
 Costa Rica
-
 Cote d'Ivoire
-
 Croatia
-
 Cyprus
-
 Czech Republic
-
 Denmark
-
 Dominican Republic
-
 Ecuador
-
 Egypt
Egypt
-
 Estonia
-
 Eswatini
-
 Ethiopia
-
 Finland
-
 France
-
 Georgia
-
 Germany
-
 Ghana
Ghana
-
 Greece
-
 Haiti
Haiti
-
 Hong Kong
-
 Hungary
-
 India
India
-
 Indonesia
-
 Iran, Islamic republic
-
 Iraq
Iraq
-
 Ireland
-
 Israel
-
 Italy
Italy
-
 Jamaica
-
 Japan
Japan
-
 Jordan
-
 Kazakhstan
-
 Kenya
Kenya
-
 Korea
Korea
-
 Kuwait
-
 Kyrgyzstan
-
 Laos
Laos
-
 Latvia
-
 Lebanon
-
 Libyan Arab Jamahiriya
-
 Lithuania
-
 Luxembourg
-
 Macedonia
-
 Madagascar
-
 Malaysia
-
 Malta
Malta
-
 Mauritius
-
 Mexico
-
 Moldova
-
 Mongolia
-
 Montenegro
-
 Morocco
-
 Mozambique
-
 Namibia
-
 Nepal
Nepal
-
 Netherlands
-
 Nigeria
-
 Norway
-
 Oman
Oman
-
 Pakistan
-
 Palestine
-
 Papua New Guinea
-
 Peru
Peru
-
 Philippines
-
 Poland
-
 Portugal
-
 Puerto Rico
-
 Qatar
Qatar
-
 Romania
-
 Rwanda
-
 Saudi Arabia
-
 Serbia
-
 Singapore
-
 Slovakia
-
 Slovenia
-
 Somalia
-
 South Africa
-
 Spain
Spain
-
 Sri Lanka
-
 Sweden
-
 Switzerland
-
 Syrian Arab Republic
-
 Taiwan
-
 Tajikistan
-
 Tanzania, United Republic Of
-
 Thailand
-
 Trinidad and Tobago
-
 Tunisia
-
 Turkey
-
 UAE
UAE
-
 Uganda
-
 Ukraine
-
 United Kingdom
-
United States
-
 Uzbekistan
-
 Venezuela
-
 Vietnam
-
 Yemen
Yemen
-
 Zambia
-
 Zimbabwe
- Forex
- Crypto

