Volume Profile Indicator: A Trader’s Guide


Editorial Note: While we adhere to strict Editorial Integrity, this post may contain references to products from our partners. Here's an explanation for How We Make Money. None of the data and information on this webpage constitutes investment advice according to our Disclaimer.

The Volume Profile indicator is a complex tool that displays trading activity at each price level on a specified timeframe. Methods and principles of using Volume Profile include:
- Profile Shape Analysis for assessing trend strength or identifying its absence
- The Highest Volume Level, or Point of Control, for finding support and resistance levels
- Value Area for identifying potential breakouts and new trends
- Single Prints for establishing market imbalances
Volume Profile gives traders a unique opportunity to visualize market activity at different price levels. This tool helps find areas where the main trading volumes are concentrated and areas where trading was underactive. Volume Profile enables traders to analyze market changes, providing additional data for making informed decisions. However, interpreting the indicator’s readings involves subjectivity and requires significant learning efforts.
This article aims to help traders start using Volume Profile in order to improve their trading strategies and general performance.
How does the Volume Profile indicator work?
How many shares of the XYZ company were traded today at $100?
This is a simple question, and Volume Profile is used to answer such and similar questions.
The Volume Profile indicator works in the following way. It:
Filters all trades that were made over a certain period at a certain price
Sums up the volumes of these trades
Displays the results on the price chart
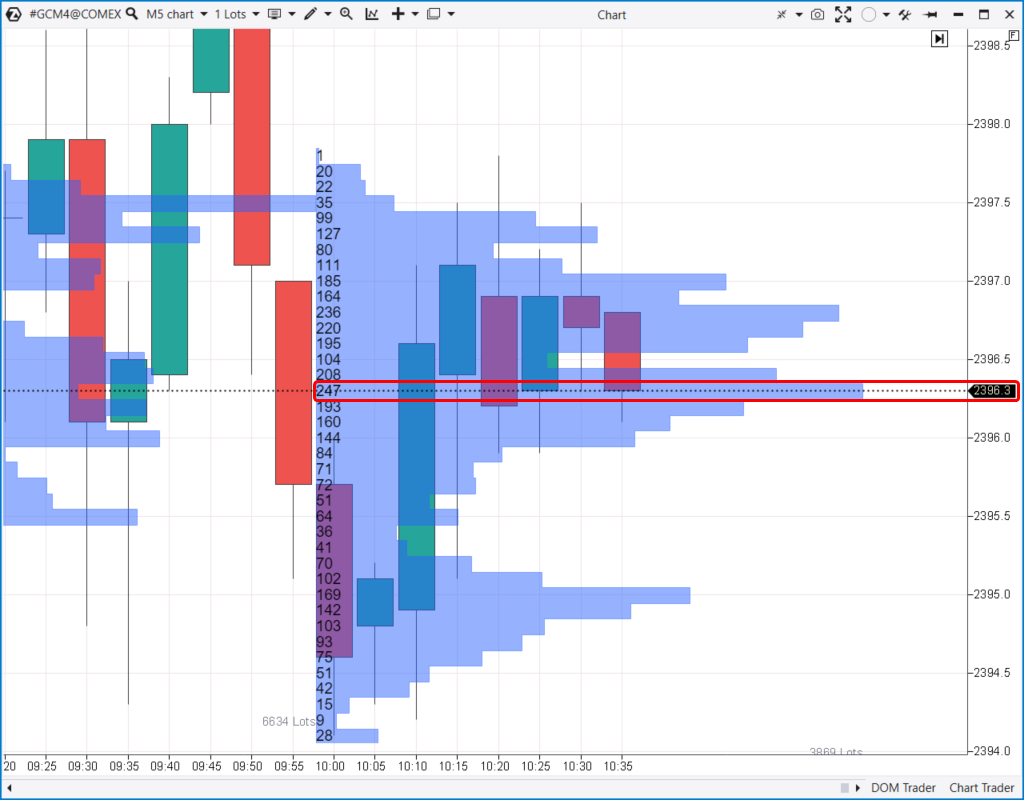 Hourly Volume Profile in the gold futures market
This chart shows the Volume Profile indicator as a blue histogram. The screenshot is from ATAS, a professional trading platform that was specially developed for volume analysis.
In the example above, the indicator shows that after 10:00, the biggest number of contracts, namely 247, were traded at $2396.3 per contract (the price of 1 ounce).
Choosing a broker for volume-based trading
Using the Volume Profile indicator requires precise data and reliable execution. Since this tool is often applied on lower timeframes and near key price levels, traders benefit from platforms that provide stable pricing, fast order execution, and access to advanced charting tools.
Below is a selection of brokers that offer suitable trading conditions and platforms for applying volume-based analysis strategies.
| zForex | Plus500 | OANDA | Trading.com USA | FOREX.com | |
|---|---|---|---|---|---|
|
Min. deposit, $ |
10 | 100 | No | 50 | 100 |
|
Tradable assets |
80 | 2800 | 129 | 69 | 5500 |
|
Standard EUR/USD spread |
0.3 | 0.7 | 0.3 | 1.1 | 1.0 |
|
Max. leverage |
1:1000 | 1:300 | 1:200 | 1:50 | 1:50 |
|
Max. Regulation Level |
Not regulated | Tier-1 | Tier-1 | Tier-1 | Tier-1 |
|
TU overall score |
8.05 | 7.57 | 6.89 | 6.15 | 6.87 |
|
Open an account |
Go to broker Your capital is at risk.
|
Go to broker 80% of retail CFD accounts lose money. |
Go to broker Your capital is at risk. |
Go to broker Your capital is at risk. |
Study review |
How do you use the Volume Profile indicator?
Volume Profile can be used in various ways. Below, I will explain just a few of them:
Market trend assessment
Finding support and resistance levels
Value Area identification
Single Prints analysis
Market trend assessment
As you know, the market can be either flat or trending.
| Flat | Trending | |
|---|---|---|
| Price action | The price moves in a range | The price ascends or descends in the trend channel |
| What it means | Supply and demand are balanced | Supply and demand are imbalanced |
| Volume profile shape | Bell curve (Gaussian distribution) | Narrow profile |
The profile helps determine the market’s current state.
Here is an example:
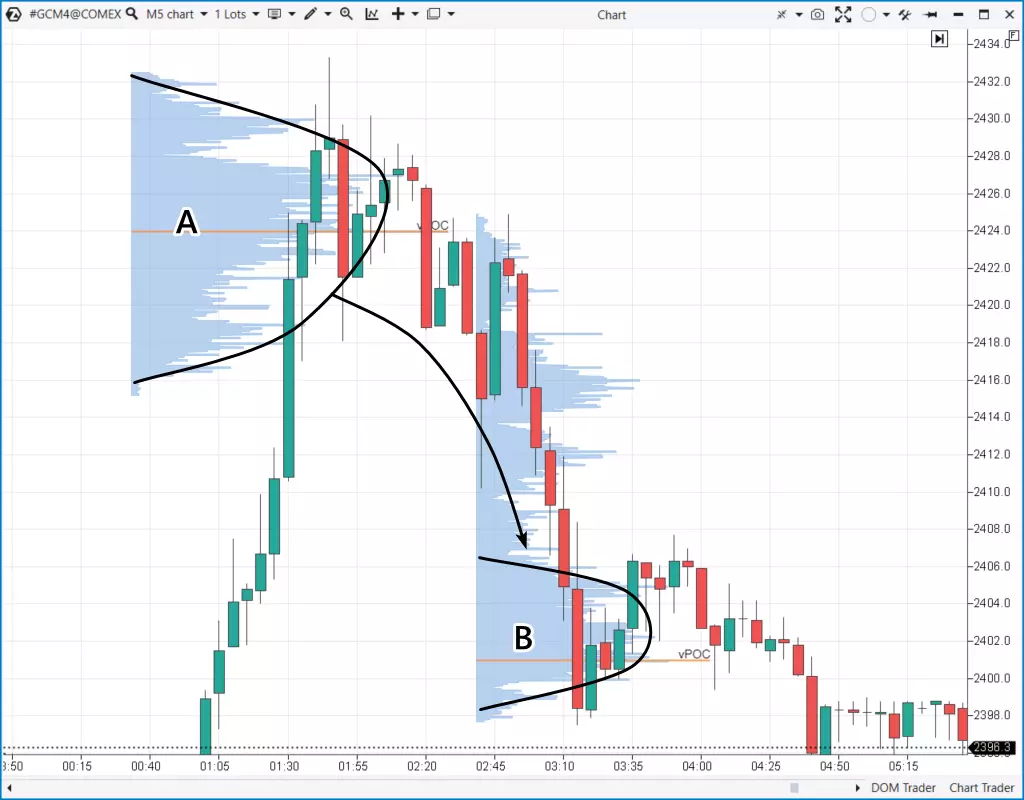 Volume profile analysis in the gold futures market
The 5-minute timeframe chart shows that:
After a growth period, buyers and sellers reached a consensus. This is displayed by the convex shape of the volume profile distribution (А). The highest volume was traded at $2424.0 per contract
Due to new factors, the balance between buyers and sellers was tipped. Demand decreased and the price went down. This was a trending stage with a typical narrow profile
Then, a new balance formed. Another convex (В) started growing, and the highest trading volume was at $2401.0 per contract
Traders pay attention not only to the alternation of convex profiles (typical of flat markets) and narrow profiles (typical of trending markets), but also to profile shapes. For example, there are b-shaped and p-shaped profiles that reflect the details of changes in supply and demand balances.
Finding support and resistance levels
The highest volume level on a profile indicator is called the Point of Control (POC). It is considered to serve as a support or resistance level.
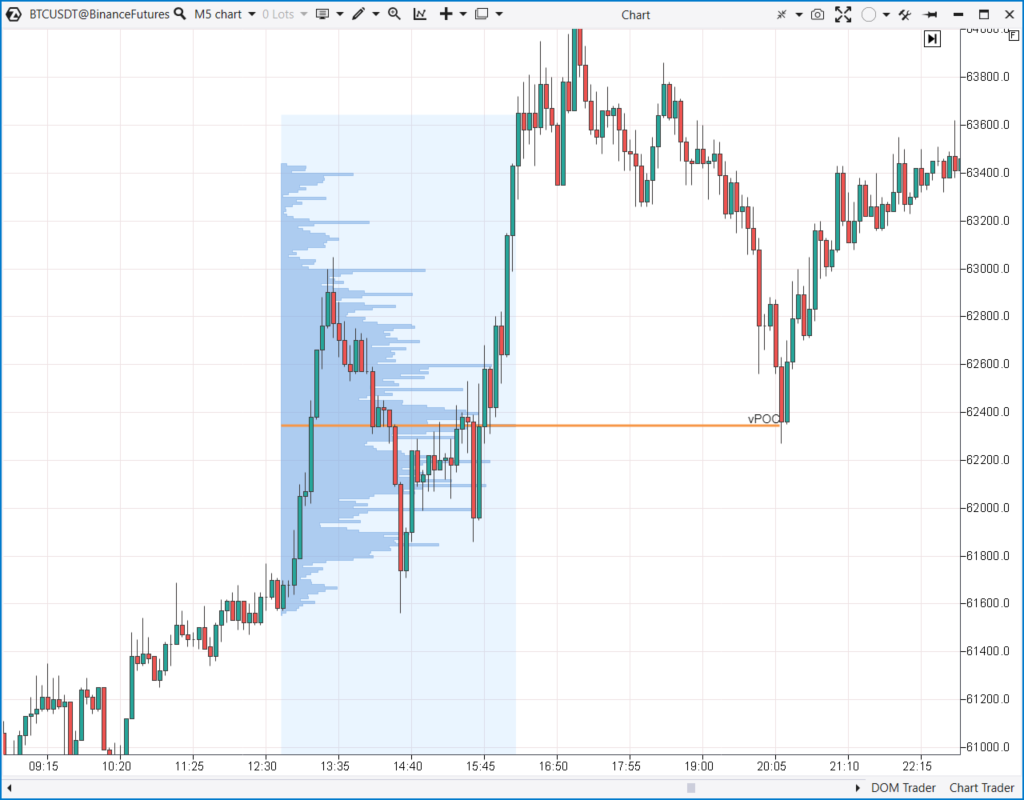 Point of Control in the Bitcoin market
This chart shows how the POC level, at which the highest volume was traded in the analyzed period, became a support level after the price started moving up. Thus, using the Volume Profile data, traders could join the uptrend with low risk.
Value Area identification
In the Volume Profile context, a Value Area is a price range that contains a considerable part of the trading activity – usually 70-80% of the whole trading volume in the analyzed period. This metric is used to find levels where the market was steady and most of the trading was concentrated.
 A volume profile on a S&P-500 futures chart
The volume profile above shows a bulge that formed after a price drop period. This bulge means that trading volume increased when more traders found a consensus regarding the price. An agreement on the fair value identified by the Volume Profile indicator often points to the highest or the lowest price in the Value Area. In the example above, it was the highest price, or the Value Area High (VAH), which acted as resistance the next day.
Single Prints
In terms of volume profiles, Single Prints are the levels where trading was minimal during a given period. These may be sections where the price moved quickly, leaving gaps in the volume profile. Single Prints can indicate strong levels of support or resistance because one of the sides had an unconditional advantage at these levels.
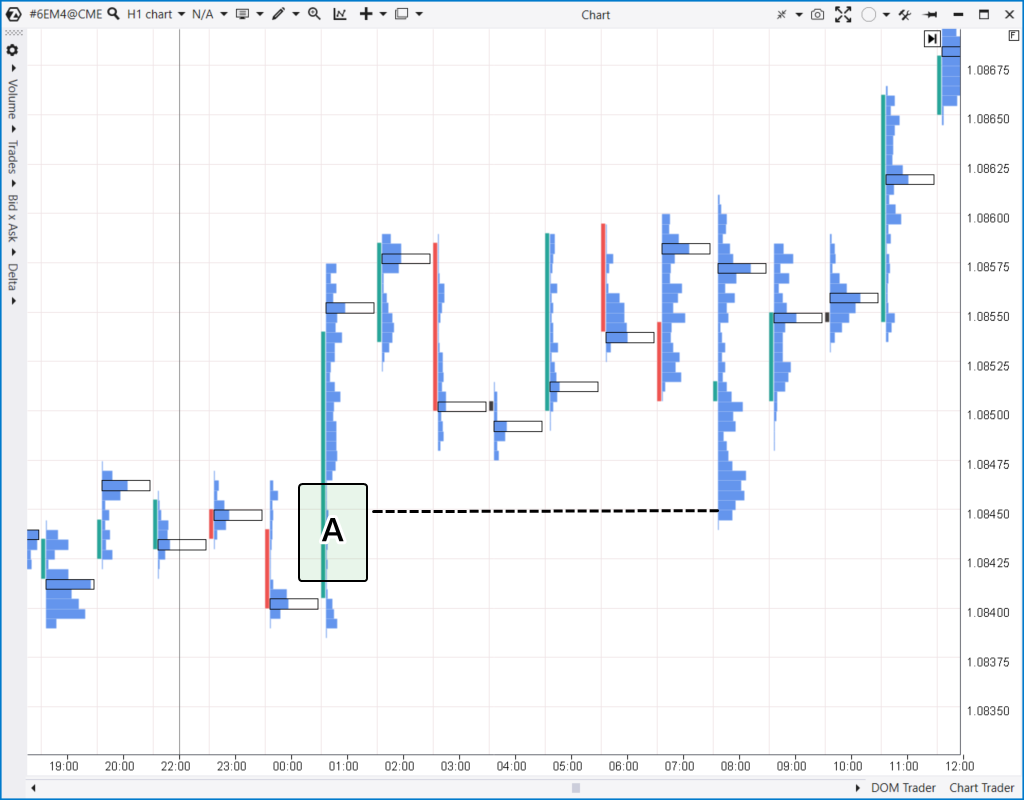 Single Prints on a EUR futures chart
The chart above shows single prints (А) that formed on the profile as the price rose from 1.08415 to 1.08465, suggesting that demand prevailed. Expectedly, when the price got back to that area the same day, it found support (supply was still limited).
How to start using the Volume Profile indicator?
To start using Volume Profile, follow this process:
Study: Read articles and books on volume profile analysis, including the books by James Dalton, Peter Steidlmayer, and other reputable authors
Choose a platform: Make sure your trading platform supports Volume Profile indicators. Some of the popular platforms are ATAS, TradingView, NinjaTrader, and ThinkorSwim
Practice: Look at the market’s recent history. Note the way volume was distributed across different price levels and the shapes the profile took during reversals, tests, and breakouts
Trade: Use the knowledge you gained to develop your volume profile trading strategy
To avoid negative experience using the Volume Profile indicator in trading, start with a demo account. Do not risk large amounts of money.
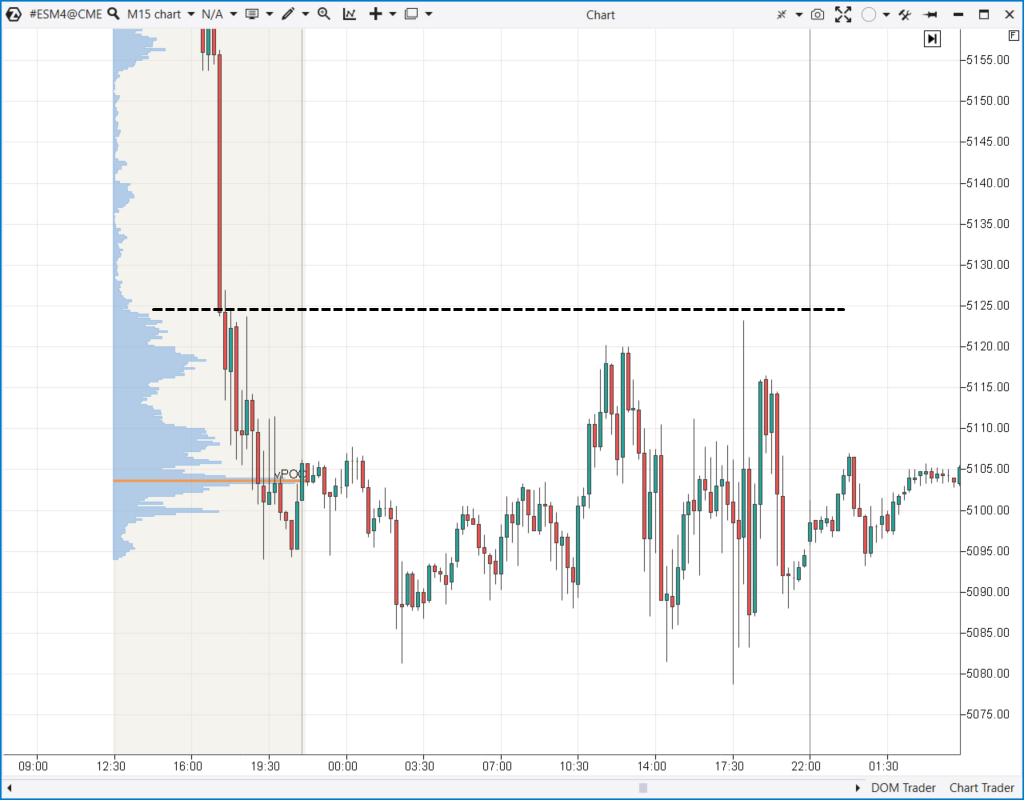
Does MT4 have Volume Profile?
No, the popular MetaTrader 4 platform does not have a built-in Volume Profile indicator, but users can download it from the library at a small cost.
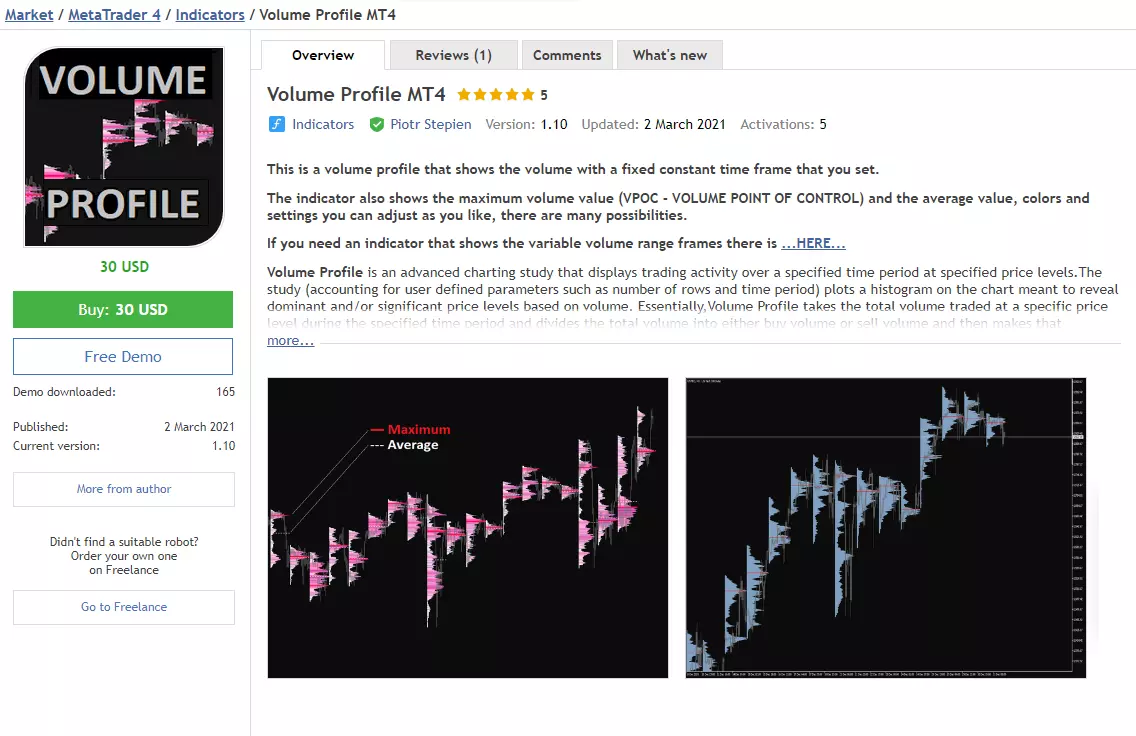 The Volume Profile indicator for МТ4
It’s worth noting that Volume Profile requires quality input data, especially for lower timeframe analysis. Therefore, if you want to use volume profiles in Forex, it may be best to analyze currency futures trading volumes on the Chicago Mercantile Exchange (CME).
Does TradingView have a Volume Profile?
Yes, the TradingView platform allows using several variations of Volume Profile – both built-in indicators and those added by traders.
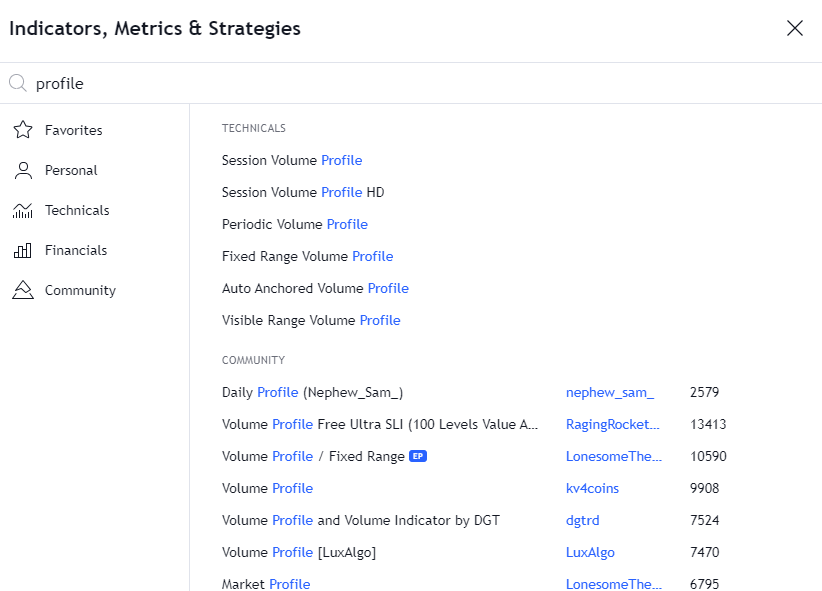 Volume Profile indicators available on TradingView
Is it worth using Volume Profile indicators on TradingView?
- Pros:
- Cons:
- Convenient to use online
- Attractive appearance
- In my view, they are not accurate enough
- Using them may involve additional expenses
What is the best Volume Profile indicator?
Remember the question at the beginning of the article: “How many shares of the XYZ company were traded today at $100?” There can be only one correct answer, so the use of different versions of indicators should always give the same correct answer.
Among the criteria that may be applied to choose “the best” tool for volume profile analysis, I will point out:
Timeframe settings
Trading platforms offer Volume Profile Visible Range (VPVR), Volume Profile Fixed Range (VPFR), and Volume Profile Session (VPSV). They seem to be different indicators, but in fact, this is the same profile, only with different ways of selecting timeframes. The best tool may be one that provides maximum flexibility – up to building volume profiles for any section of a chart.
Visualization
The best Volume Profile indicator must meet your aesthetic preferences and have numerous settings for colors, fonts, transparency, etc.
Features
The most progressive versions of Volume Profile indicators enable users to:
Analyze bid and ask volumes separately
Set proportions for thin and convex profiles
Set alerts for specified levels
Traders often use Volume Profile indicators on such platforms as TradingView, ATAS, NinjaTrader, or ThinkorSwim that provide advanced features for charting and technical analysis. Each platform can have its own unique versions of these indicators. Traders should experiment with these tools to see which ones best suit their trading strategies and provide the clearest data for market activity.
Is volume a good indicator?
Trading volume is one of the key indicators in financial markets, as it shows traders’ activity and interest in specified assets during specified time periods. Volumes help traders understand how strong or weak a current trend is, find support and resistance levels, reduce risks, and achieve other goals in trading.
- Benefits of using the Volume Profile indicator
- What are the disadvantages of using Volume Profile?
- The indicator:
- is applicable to various timeframes and markets, such as Forex, crypto, and stocks
- helps traders better understand the market by structuring balances and imbalances
- identifies key levels of support and resistance, where volumes were the highest or especially low (where one of the sides had an advantage)
- analyzes trends and predicts reversals. Volumes can confirm the steadiness or weakening of trends
- focuses on large market players that operate large volumes
- Volume Profile is not a means to get rich quickly and easily.
- Complexity of interpretation: It can be difficult for beginners to interpret volume data properly, as it requires users to understand many patterns of market participants’ behavior
- Dependence on platforms: Not all trading platforms provide volume profile analysis tools, and access to them can sometimes be limited or paid
- Requirements for data: The indicator’s effectiveness depends on the quality and completeness of trading data. In the markets where volume information is incomplete (for example, Forex), the use of Volume Profile can be less informative
Volume Profile is powerful but requires context
I consider Volume Profile one of the most insightful tools for understanding market structure, but it is often misunderstood. Many traders treat it as a standalone signal generator, while in reality it works best when combined with price action and broader market context.
In my approach, the key value lies in identifying areas of agreement and imbalance. High-volume zones highlight where the market accepted price, while low-volume areas often signal rejection. However, these levels should not be traded blindly. I always look for confirmation through reaction, not just presence.
For most traders, the challenge is not the tool itself but interpretation. I recommend starting with simple observations such as Point of Control and Value Area, and only then moving to more advanced concepts. A structured approach usually leads to better consistency than trying to use all features at once.
Conclusion
The Volume Profile indicator stands out as a powerful tool for traders aiming to understand the true dynamics behind price action, uncovering areas of significant trading activity that reveal support, resistance, and market consensus. Its most impactful use comes from identifying high-volume zones—such as the Point of Control and Value Area—that often forecast future price reactions, as seen when these levels become magnets for price during trend shifts in gold or S&P-500 futures. However, the real strength of Volume Profile lies not in treating it as a standalone signal but in integrating its insights into a broader analysis framework, always seeking confirmation before acting. Traders should approach the tool with a commitment to learning and practice, leveraging demo accounts and reputable platforms. Ultimately, mastering Volume Profile can provide a unique edge, enabling traders to navigate markets more intelligently by visualizing where the real battles between buyers and sellers take place.
FAQs
What types of markets are suitable for using the Volume Profile indicator?
How can analyzing profile shapes improve trading decisions?
Why is data quality important when using the Volume Profile indicator?
What common mistakes should beginners avoid when interpreting the Volume Profile indicator?
Editors' Top Picks and Insights

Lindsey Graham death: U.S. senator’s crypto legacy

Tether under pressure: USDT in Europe, audit questions, and the fight for trust

Lean Ethereum: Why Buterin wants to rebuild the network

SK Hynix debuts on Nasdaq: Largest U.S. offering by foreign company

SpaceX falls out of orbit: Does anyone still want Musk’s stock?

The crypto IPO problem: How high-profile listings became investor traps
Related Articles
Team that worked on the article
Andrey Mastykin is an experienced author, editor, and content strategist who has been with Traders Union since 2020. As an editor, he is meticulous about fact-checking and ensuring the accuracy of all information published on the Traders Union platform.
Dr. BJ Johnson is a PhD in English Language and an editor with over 15 years of experience. He earned his degree in English Language in the U.S and the UK.
Mirjan Hipolito is a journalist and news editor at Traders Union. She is an expert crypto writer with five years of experience in the financial markets.
Ethereum is a decentralized blockchain platform and cryptocurrency that was proposed by Vitalik Buterin in late 2013 and development began in early 2014. It was designed as a versatile platform for creating decentralized applications (DApps) and smart contracts.
An investor is an individual, who invests money in an asset with the expectation that its value would appreciate in the future. The asset can be anything, including a bond, debenture, mutual fund, equity, gold, silver, exchange-traded funds (ETFs), and real-estate property.
Bitcoin is a decentralized digital cryptocurrency that was created in 2009 by an anonymous individual or group using the pseudonym Satoshi Nakamoto. It operates on a technology called blockchain, which is a distributed ledger that records all transactions across a network of computers.
Scalping in trading is a strategy where traders aim to make quick, small profits by executing numerous short-term trades within seconds or minutes, capitalizing on minor price fluctuations.
CFD is a contract between an investor/trader and seller that demonstrates that the trader will need to pay the price difference between the current value of the asset and its value at the time of contract to the seller.

-
 Afghanistan
-
 Albania
-
 Algeria
-
 Angola
-
 Argentina
-
 Armenia
-
 Australia
-
 Austria
-
 Azerbaijan
-
 Bahamas
-
 Bahrain
-
 Bangladesh
-
 Belarus
-
 Belgium
-
 Bolivia
-
 Botswana
-
 Brazil
-
 Brunei
-
 Bulgaria
-
 Cambodia
-
 Cameroon
-
 Canada
-
 Chile
Chile
-
 China
China
-
 Colombia
-
 Congo
Congo
-
 Costa Rica
-
 Cote d'Ivoire
-
 Croatia
-
 Cuba
Cuba
-
 Cyprus
-
 Czechia
-
 DR Congo
-
 Denmark
-
 Dominican Republic
-
 Ecuador
-
 Egypt
Egypt
-
 El Salvador
-
 Estonia
-
 Eswatini
-
 Ethiopia
-
 Finland
-
 France
-
 Georgia
-
 Germany
-
 Ghana
Ghana
-
 Greece
-
 Haiti
Haiti
-
 Hong Kong
-
 Hungary
-
 India
India
-
 Indonesia
-
 Iran, Islamic republic
-
 Iraq
Iraq
-
 Ireland
-
 Israel
-
 Italy
Italy
-
 Jamaica
-
 Japan
Japan
-
 Jordan
-
 Kazakhstan
-
 Kenya
Kenya
-
 Korea
Korea
-
 Kuwait
-
 Kyrgyzstan
-
 Laos
Laos
-
 Latvia
-
 Lebanon
-
 Lesotho
-
 Libya
Libya
-
 Lithuania
-
 Luxembourg
-
 Madagascar
-
 Malaysia
-
 Malta
Malta
-
 Mauritius
-
 Mexico
-
 Moldova
-
 Mongolia
-
 Montenegro
-
 Morocco
-
 Mozambique
-
 Myanmar
-
 Namibia
-
 Nepal
Nepal
-
 Netherlands
-
 New Zealand
-
 Nigeria
-
 North Macedonia
-
 Norway
-
 Oman
Oman
-
 Pakistan
-
 Palestine
-
 Panama
-
 Papua New Guinea
-
 Paraguay
-
 Peru
Peru
-
 Philippines
-
 Poland
-
 Portugal
-
 Puerto Rico
-
 Qatar
Qatar
-
 Reunion
-
 Romania
-
 Rwanda
-
 Saudi Arabia
-
 Serbia
-
 Singapore
-
 Slovakia
-
 Slovenia
-
 Somalia
-
 South Africa
-
 Spain
Spain
-
 Sri Lanka
-
 Sweden
-
 Switzerland
-
 Syria
Syria
-
 Taiwan
-
 Tajikistan
-
 Tanzania
-
 Thailand
-
 Trinidad and Tobago
-
 Tunisia
-
 Turkey
-
 UAE
UAE
-
 Uganda
-
 Ukraine
-
 United Kingdom
-
United States
-
 Uruguay
-
 Uzbekistan
-
 Venezuela
-
 Vietnam
-
 Yemen
Yemen
-
 Zambia
-
 Zimbabwe
- Forex
- Crypto
