How To Use The Market Facilitation Index To Read Real Market Strength


Editorial Note: While we adhere to strict Editorial Integrity, this post may contain references to products from our partners. Here's an explanation for How We Make Money. None of the data and information on this webpage constitutes investment advice according to our Disclaimer.
The Market Facilitation Index (MFI) measures how efficiently price moves in relation to volume within each candle. It helps traders spot real market intent by showing whether price movement is backed by strong volume or lacking momentum. Color-coded bars highlight if a trend is building strength, losing steam, or faking out — giving you early cues before breakouts or reversals.
The Market Facilitation Index (MFI) is not meant to show the trend. It helps you figure out how much work the market is doing to move the price. Most traders chase candles but never ask if the move is putting volume to good use or just burning out. If MFI jumps and price barely budges, something is off. But if MFI rises and price follows smoothly, that means the market is flowing right. In this article, we will take a detailed look into this indicator, talking about its origin, calculation, strategies, and important tips.
Introduction to market facilitation index
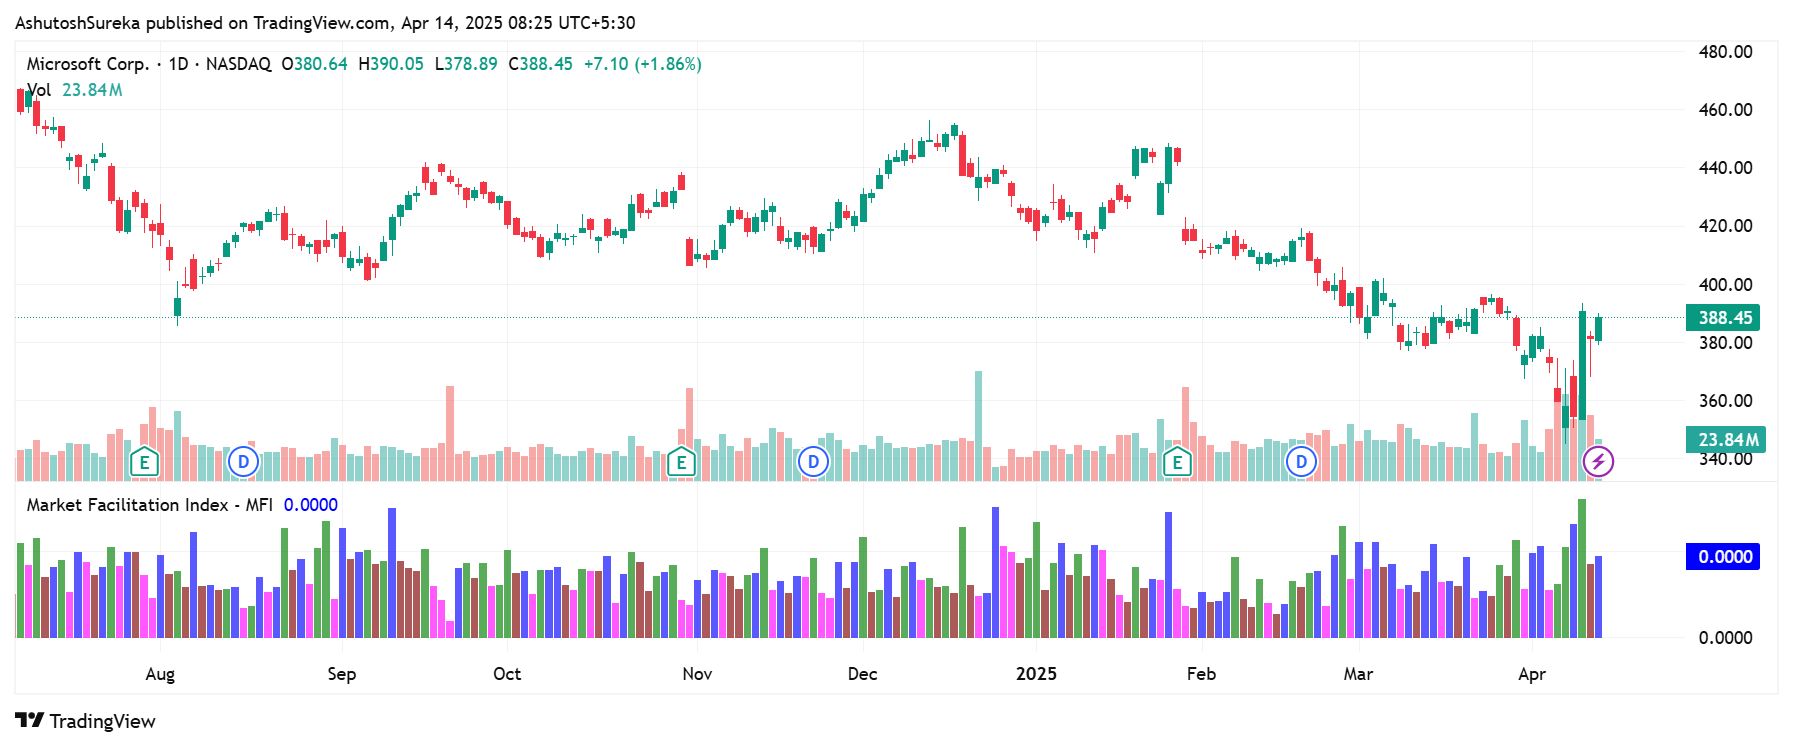
The market facilitation index is a unique volume-based indicator that helps traders understand how efficiently the market is moving. It measures the relationship between price change and volume in a single candle. In simpler terms, it shows whether the market is moving with strength, hesitation, or without much interest at all.
The indicator is used to identify the mood of the market — whether buyers or sellers are active and how committed they are. It helps traders see if a move is happening with strong support or just drifting without volume. By analyzing the color-coded bars of the MFI, you can quickly spot whether a trend is gaining momentum, losing steam, or simply moving sideways.
What the MFI shows
Strong moves with rising volume suggest growing conviction.
Weak price changes with low volume indicate a quiet, indecisive market.
Spikes in the MFI followed by volume drops may warn of exhaustion or reversal.
Best used with price action, candlestick patterns, and support or resistance zones.

Origin and development of market facilitation index
The market facilitation index was developed by Bill Williams, a well-known trader, psychologist, and author. He introduced the indicator in his book Trading Chaos, where he explored the idea that markets are influenced not just by price, but by how price reacts to changes in volume and momentum.
Why it was created
Bill Williams wanted a tool to measure how easily price moves on any given volume.
Unlike traditional indicators that focus solely on trend direction or strength, this one focuses on market behavior.
The goal was to help traders identify when the market was efficient, emotional, or out of balance.
How the indicator evolved
Originally used by discretionary traders to spot changes in sentiment.
Gained popularity as part of Bill Williams’ broader system, which includes the alligator and fractals.
Became part of many trading platforms under volume-based tools.
Why it still matters today
Offers a fast way to assess market mood at a glance.
Helps avoid entering trades when the market is inactive or manipulated.
Especially useful for breakout and trend traders who want volume-backed confirmation.
Understanding the components of market facilitation index
The market facilitation index may look simple, but each bar gives insight into the strength or weakness of a price move. The indicator is made up of color-coded bars, each showing how much the market is moving for every unit of volume. Understanding these components helps traders spot when the market is about to take off — or when it's better to wait.
The formula behind the MFI
At its core, the MFI compares price movement to volume within a single candle.
MFI = (High − Low) ÷ Volume
This tells you how much price moved for each unit of volume. A high MFI value means the market moved a lot with little volume, or the price covered a wide range easily. A low MFI value shows that even with volume, price didn’t move much — suggesting hesitation or lack of interest.
The four color-coded bar types
Bill Williams introduced a color-based interpretation to help traders quickly understand what the market is doing. Most platforms color the bars differently based on changes in both MFI and volume.
1. Green bar (MFI and volume increase)
Strong price movement backed by strong volume.
Suggests growing interest and possible trend continuation.
Often seen during the early stages of a breakout.
2. Brown bar (MFI and volume decrease)
Low price movement with falling volume.
Indicates a quiet, uncertain market.
Best to avoid trading during this phase.
3. Blue bar (MFI up, volume down)
Price is moving, but volume is dropping.
May show a false move with little real support.
Signals caution as it could be a trap before reversal.
4. Pink bar (MFI down, volume up)
Volume increases but price struggles to move.
Shows conflict between buyers and sellers.
Often appears before sharp breakouts or trend changes.
How to read the bars
Use bar colors to quickly assess market behavior.
Combine with support and resistance to validate the signals.
Avoid overreacting to a single bar — look for clusters or patterns.
How to set up market facilitation index
The market facilitation index is available on most modern trading platforms and can be added with just a few clicks. Once it’s on your chart, the indicator automatically calculates and displays color-coded bars based on price movement and volume. Setting it up properly ensures you get the clearest possible view of market activity.
Access the indicator
Adding the market facilitation index to your chart is fast and straightforward.
How to do it
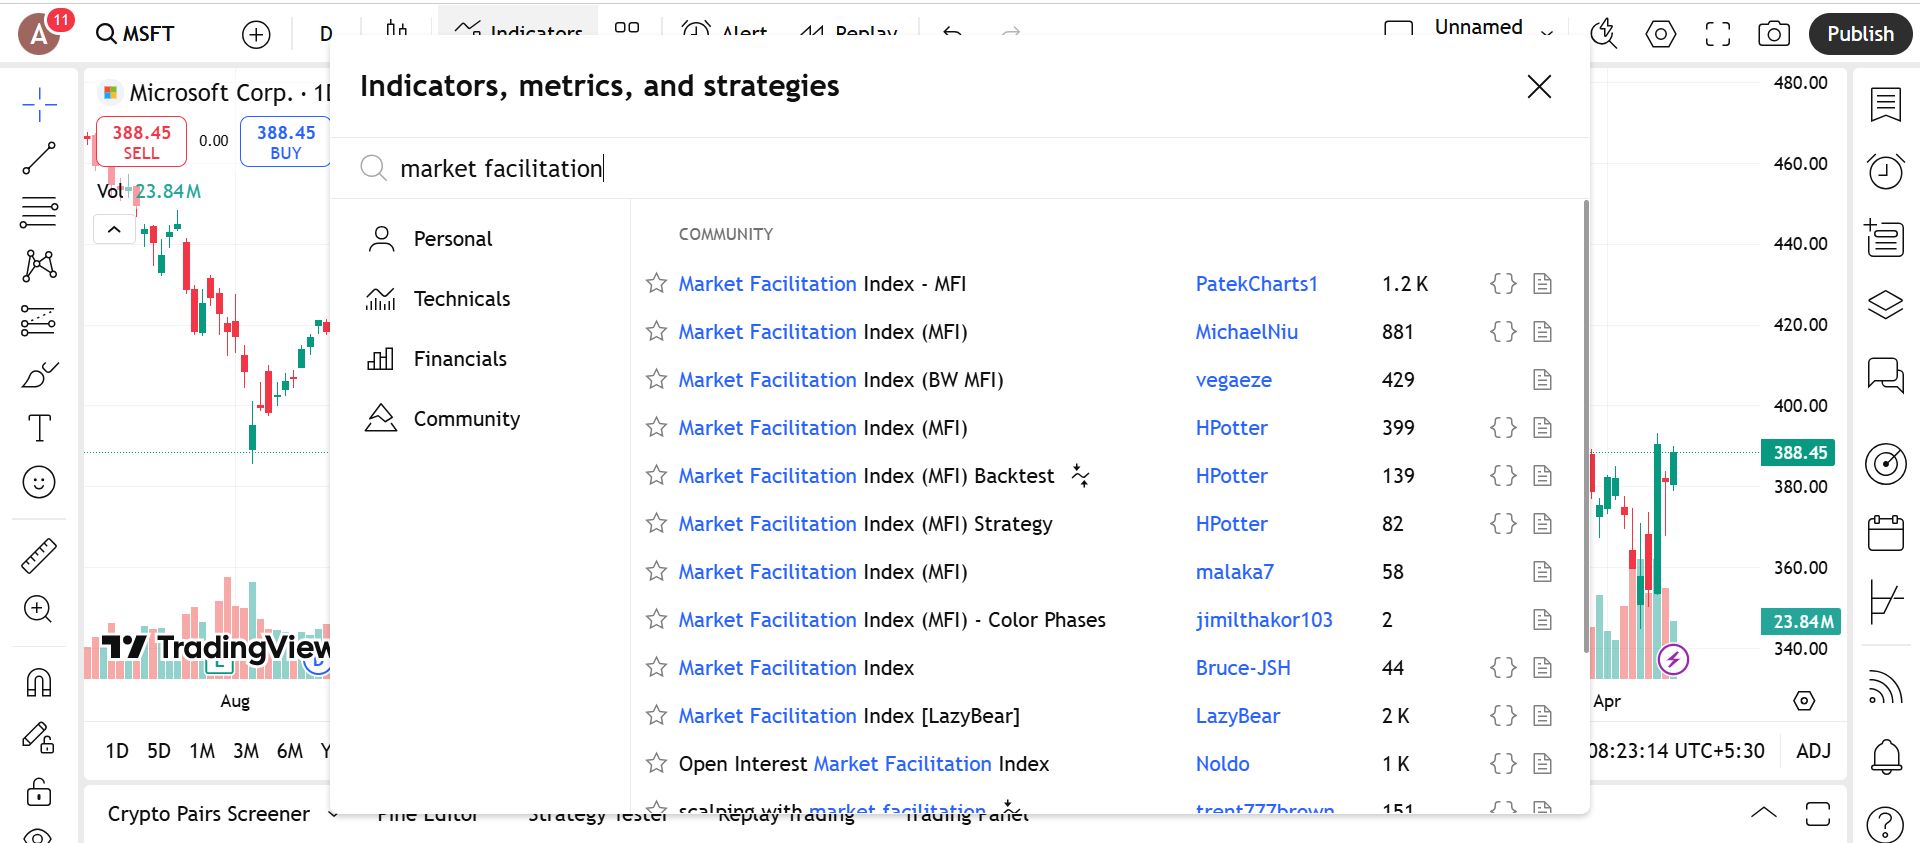
Open the indicators menu in your charting platform.
Type Market Facilitation Index in the search bar.
Click to apply it. The line will appear below your main chart in a separate pane.
Where it’s available
Pre-installed on TradingView, ThinkorSwim, MetaTrader 4 and 5, and most other charting tools.
No external downloads or plug-ins are required.
Configure the parameters
This indicator is designed to be plug-and-play, meaning you usually don’t need to change any settings. However, some platforms allow minor adjustments for visibility and analysis style.
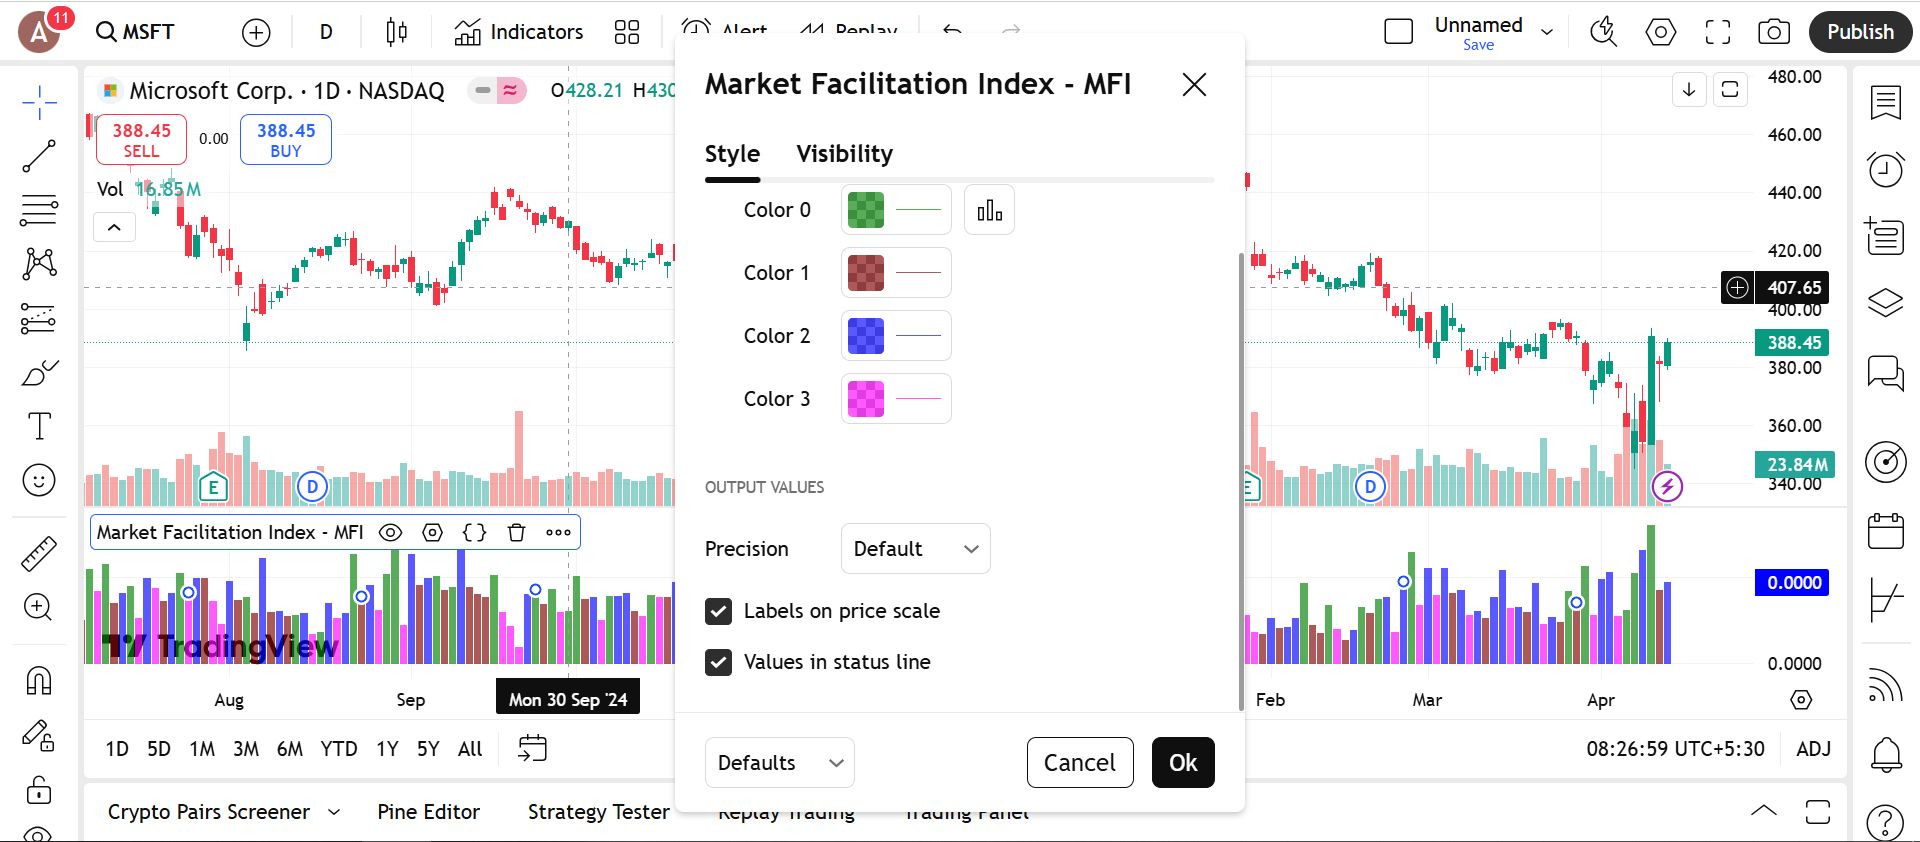
Customization options
Bar color settings
Some platforms let you manually assign or adjust bar colors for better visibility, especially on dark or custom chart themes.Volume source selection
A few advanced platforms allow you to choose how volume is calculated (real vs tick volume) depending on asset type.Chart style compatibility
Make sure your chart type supports volume readings (candlestick or bar charts work best). Avoid using it with line charts that do not include volume data.
Tips for setup
Stick with default settings unless visibility is a problem.
If you're trading Forex, remember MFI uses tick volume — not real volume.
Pair with support and resistance, trendlines, or breakouts for stronger signals.
Trading strategies using market facilitation index
The market facilitation index is especially useful when paired with price action tools like support and resistance. Here are some of the top trading strategies using the market facilitation index:
Breakout confirmation strategy
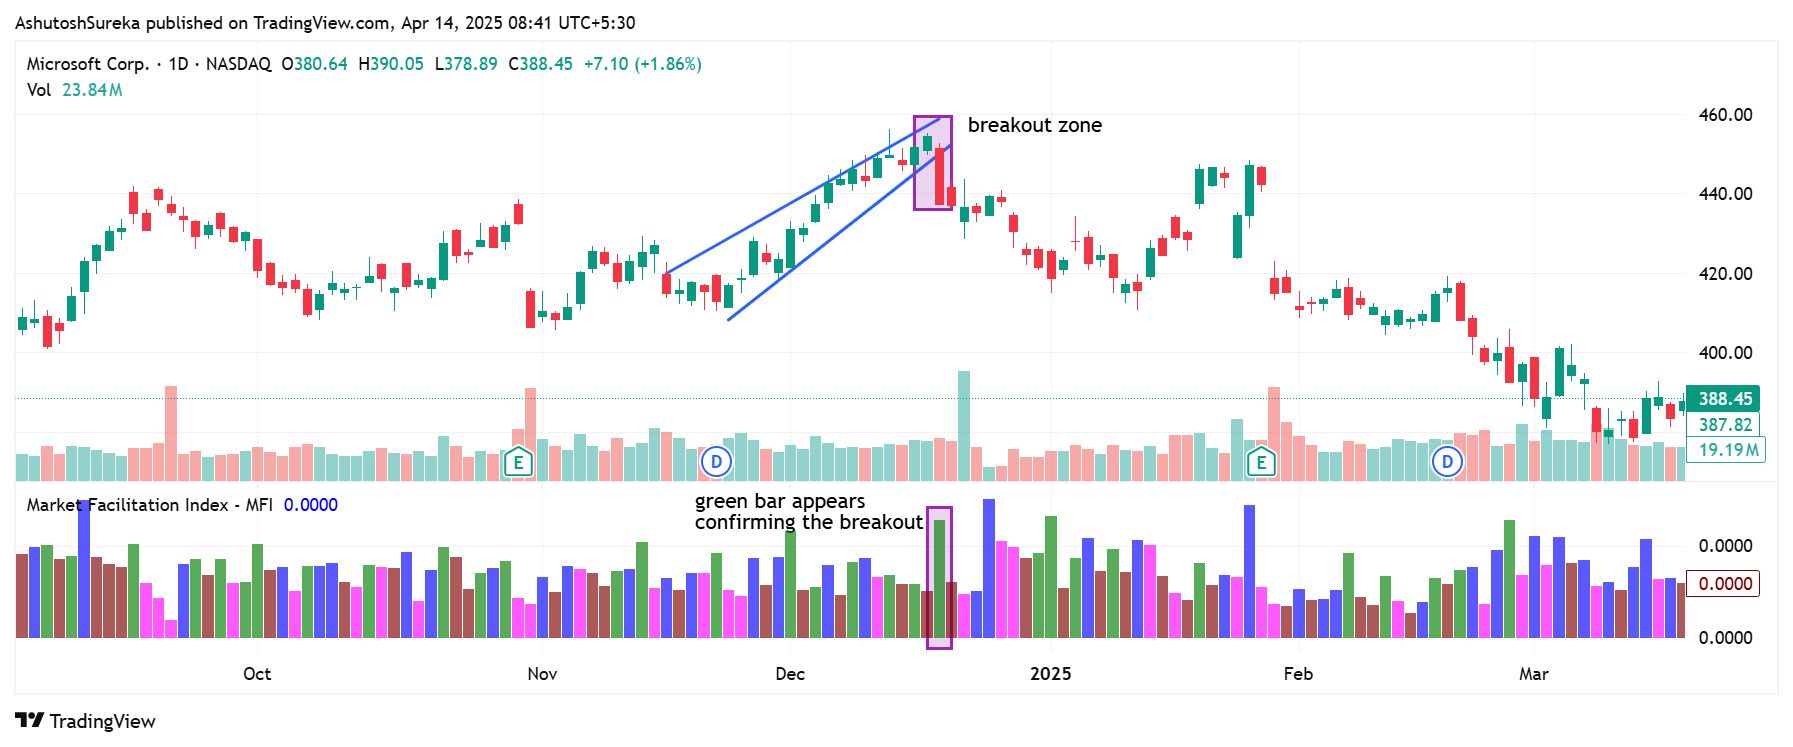
This strategy helps you avoid false breakouts and trade only when the market shows strong intent.
How to apply it
Mark major resistance or support levels.
Wait for the price to approach the level.
If a green bar appears (price and volume both rising), it confirms strength.
Enter after the breakout and set your stop loss just below or above the breakout zone.
Why it works
Green bars suggest the market is pushing through with momentum.
Helps confirm breakouts with volume, not just price.
Filters out weak or fake moves.
Reversal detection using pink bars
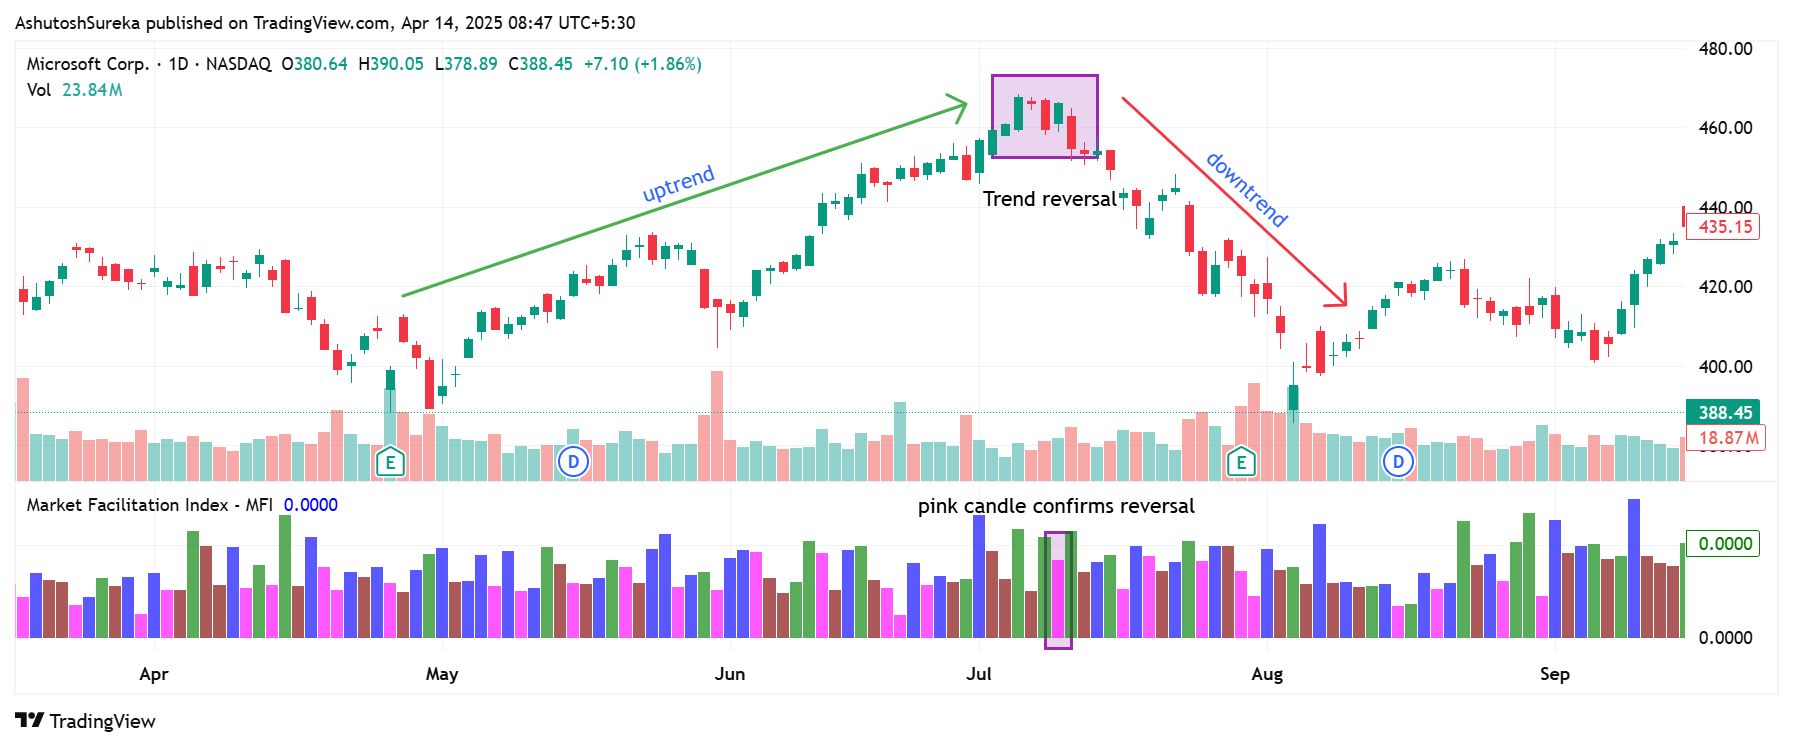
Pink bars signal rising volume but weak price movement — a sign that buyers and sellers are fighting, and a reversal might be near.
How to apply it
Watch for a trend to slow down while pink bars appear.
Look for rejection at support or resistance and confirming candles.
Enter when price breaks the opposite way, with volume fading or shifting.
Why it works
Shows indecision or exhaustion in the current trend.
Warns that momentum is not as strong as it looks.
Great for spotting early turning points.
Sideways market avoidance with brown bars
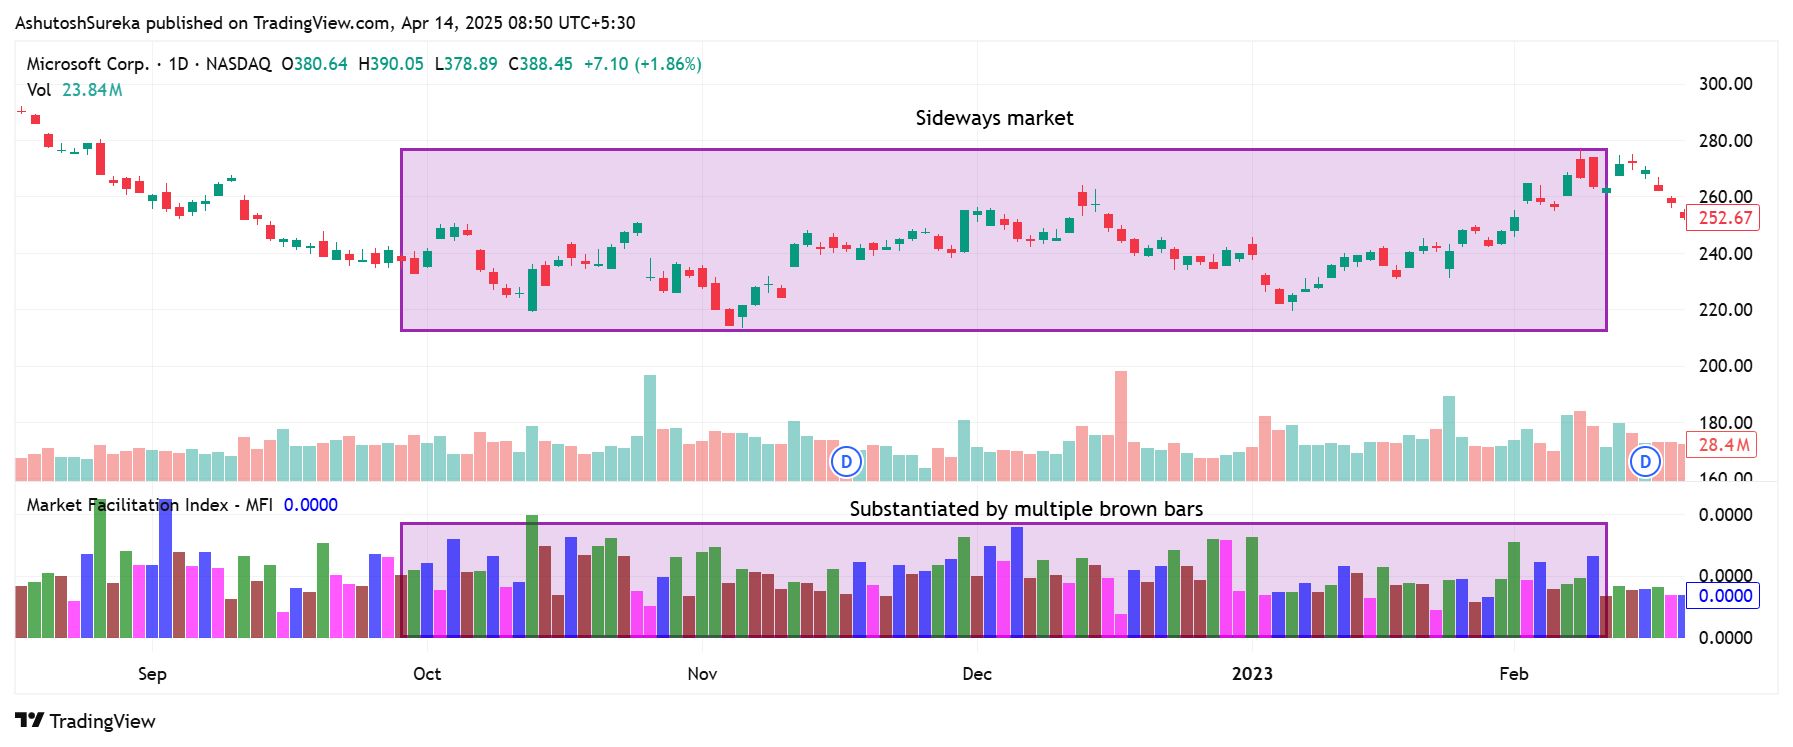
Brown bars indicate low volume and weak movement — conditions where trading is usually unproductive.
How to apply it
If the chart is showing brown bars repeatedly, stay out.
Wait for a green or pink bar to signal renewed activity.
Use this phase as a warning not to trade aggressively.
Why it works
Keeps you out of trades when the market has no energy.
Reduces false entries and emotional decisions.
Encourages patience during low-volume periods.
Blue bar caution setup
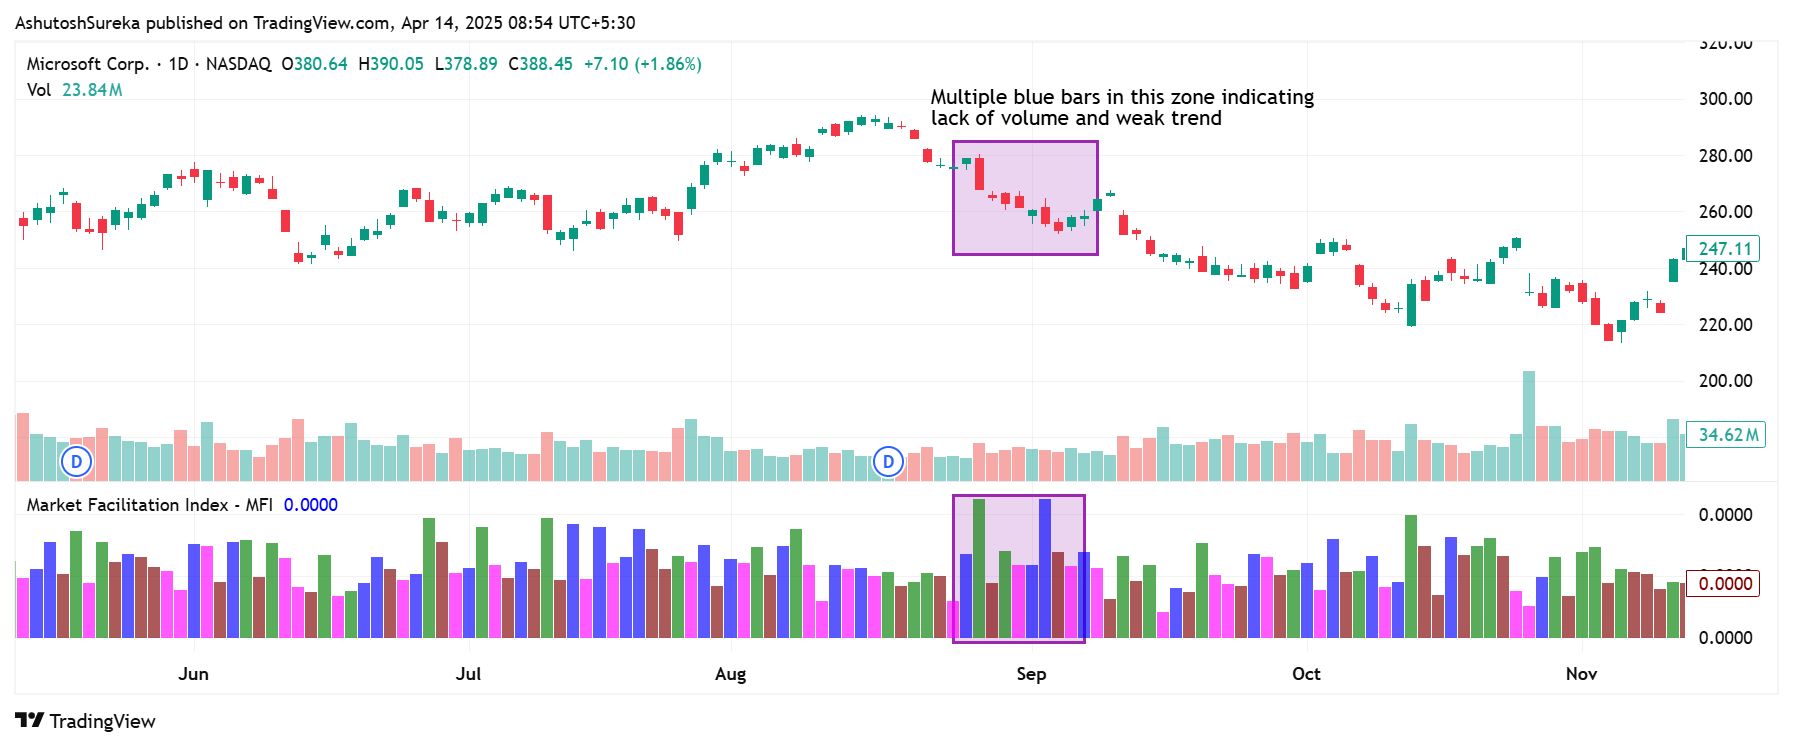
Blue bars show movement without volume. They often come before a reversal or a fake move.
How to apply it
If the price breaks a level but the bar is blue, wait.
Do not enter until a green or pink bar confirms real interest.
Look for a retest with stronger MFI support before committing.
Why it works
Helps avoid jumping into weak setups.
Waits for proper volume confirmation.
Adds discipline to breakout and reversal strategies.
If your trading approach depends on multiple technical indicators, choosing a broker that integrates with platforms like TradingView, MT5, or cTrader can significantly enhance your experience. These platforms offer extensive technical analysis features, accommodating virtually any strategy you want to implement. Below, we've compiled a comparison table of the best brokers offering access to these platforms, helping you select the most suitable one for your needs:
| Currency pairs | Crypto | Stocks | Min. deposit, $ | Max. leverage | TradingView | MT5 | cTrader | Regulation | TU overall score | Open an account | |
|---|---|---|---|---|---|---|---|---|---|---|---|
| 90 | Yes | Yes | No | 1:500 | Yes | Yes | Yes | ASIC, FCA, DFSA, BaFin, CMA, SCB, CySec | 7.17 | Open an account Your capital is at risk.
|
|
| 52 | Yes | Yes | 25 | 1:1000 | No | Yes | Yes | MISA, FSC (Mauritius) | 8.2 | Open an account Your capital is at risk. |
|
| 70 | Yes | Yes | 100 | 1:500 | No | Yes | Yes | FCA, CYSEC, FSCA, SCB, FSA (Seychelles) | 7.9 | Open an account Your capital is at risk. |
|
| 56 | Yes | Yes | 50 | 1:1000 | No | Yes | Yes | CySEC, FSC (Mauritius), SVG FSA | 7.87 | Open an account Your capital is at risk. |
|
| 61 | Yes | Yes | 200 | 1:500 | Yes | Yes | Yes | ASIC, CySEC, and FSA | 7.46 | Open an account Your capital is at risk. |
Why trust us
We at Traders Union have analyzed financial markets for over 14 years, evaluating brokers based on 250+ transparent criteria, including security, regulation, and trading conditions. Our expert team of over 50 professionals regularly updates a Watch List of 500+ brokers to provide users with data-driven insights. While our research is based on objective data, we encourage users to perform independent due diligence and consult official regulatory sources before making any financial decisions.
Learn more about our methodology and editorial policies.
Pros and cons of market facilitation index
- Pros
- Cons
Reveals market intent clearly. The MFI shows how much the market is moving for a given amount of volume. This helps you see if price action is being supported by real buying or selling, not just noise or random movement.
Color-coded bars make analysis simple. Instead of scanning complex data, the MFI uses color changes to signal what’s happening. This makes it fast and easy to spot changes in volume strength and price efficiency.
Works well for confirming breakouts and reversals. The MFI helps you check whether a breakout is backed by momentum or likely to fail. It also signals when a trend may be losing strength, giving you time to prepare for reversals.
Encourages disciplined trading. By highlighting low-activity periods (brown bars), the MFI helps you avoid overtrading and stay out of weak setups. This can lead to more selective and higher-quality trades.
Does not give exact buy or sell signals. The MFI doesn’t tell you exactly when to enter or exit. It shows changes in market behavior, but you still need to combine it with other tools for full confirmation.
Can produce false signals in low-volume markets. In thin or low-volume markets, the readings can become unreliable. The indicator may flash green or pink even if there isn’t much commitment behind the move.
Colors may be interpreted differently. Bar colors depend on both MFI and volume direction. Without understanding the logic behind them, traders may misread the signals and act too early or too late.
Limited without volume access. The indicator loses its edge in markets like Forex where tick volume is used instead of real volume. It becomes less reliable for spotting true market intent.
The MFI is loudest when the market looks quiet

The real advantage of using MFI comes when the chart looks boring but the indicator starts moving while price sits still. That is not background noise. That is the market gearing up before the move. Most new traders miss it because they expect MFI to only work during big breakouts. But the clearest signs show up before the breakout happens. If MFI starts rising and volume picks up while price holds tight, someone is quietly stepping in. You are not waiting for confirmation. You are catching what is happening early.
There is also an extra layer to notice after a failed breakout. If price breaks above a level and drops back in but MFI stays elevated, the move still has potential. It likely just cleared out nervous traders. But if MFI drops sharply too, the setup is probably done. This helps you avoid reacting too fast. MFI is not here to call direction. It tells you if the move still has energy. And that simple signal can change the way you trade the moment — without needing ten tools to agree.
Conclusion
The Market Facilitation Index is not there to tell you what to buy or sell. But it does show you if the market is working hard or moving smart. Prices can go up and still be a weak move. MFI shows you if that push makes sense or if it is just noise. When you start paying more attention to the way price moves, not just that it moves, your understanding gets sharper. And when MFI does not match what price is doing, that is your cue. The market is giving you a hint that others are too distracted to see.
FAQs
Is the market facilitation index suitable for all trading instruments?
Yes, the Market Facilitation Index can be used across stocks, Forex, commodities, and indices. It analyzes price movement efficiency relative to volume, making it adaptable to different asset classes.
Can you use the market facilitation index for short term trading?
Yes, the MFI is useful for short term trading as it helps detect shifts in market activity and momentum. It is particularly effective during breakout and high-volume phases.
Which indicators complement the MFI effectively?
Indicators like volume, RSI, and moving averages pair well with MFI. These tools help confirm trends and filter out false signals by providing context to MFI’s price-volume relationship.
What is the BW Market Facilitation Index?
The BW Market Facilitation Index, developed by Bill Williams, measures how efficiently price moves per unit of volume. It helps traders gauge market interest and potential trend strength or weakness.
Related Articles
Team that worked on the article
Anton Kharitonov is an active trader and analyst. He employs both short- and long-term trading strategies, primarily based on fundamental factors, supported by technical indicators and intermarket analysis. Anton trades major and minor currency pairs, while his primary focus is on oil futures and index CFDs.
As a financial expert and analyst at Traders Union since 2013, Anton performs thorough internal broker evaluations, referred to as “test drives.” He examines website and account interfaces, client support, software stability, deposit and withdrawal processing speed, legal documentation, and additional broker services such as VPS, affiliate programs, contests, bonuses, and training programs.
New knowledge is the key to expanding our horizons and unlocking new opportunities. Every step in learning, every new understanding empowers us become better, smarter, and stronger. Knowledge provides an advantage, enabling informed decisions, confident actions, and forward momentum. In a changing world, only those who embrace learning and adaptation can truly thrive.
Based on these evaluations, Anton prepares expert reports on the operation of Forex, stock, binary options, and cryptocurrency exchanges.
Chinmay Soni is a financial analyst with more than 5 years of experience in working with stocks, Forex, derivatives, and other assets. As a founder of a boutique research firm and an active researcher, he covers various industries and fields, providing insights backed by statistical data. He is also an educator in the field of finance and technology.
As an author for Traders Union, he contributes his deep analytical insights on various topics, taking into account various aspects.
Mirjan Hipolito is a journalist and news editor at Traders Union. She is an expert crypto writer with five years of experience in the financial markets. Her specialties are daily market news, price predictions, and Initial Coin Offerings (ICO).
Price action trading is a trading strategy that relies primarily on the analysis of historical price movements and patterns in financial markets, such as stocks, currencies, or commodities. Traders who use this approach focus on studying price charts, candlestick patterns, support and resistance levels, and other price-related data to make trading decisions.
Overtrading is a phenomenon where a trader executes too many transactions in the market, surpassing their strategy and trading more frequently than planned. It's a common mistake that can lead to financial losses.
Forex leverage is a tool enabling traders to control larger positions with a relatively small amount of capital, amplifying potential profits and losses based on the chosen leverage ratio.
Index in trading is the measure of the performance of a group of stocks, which can include the assets and securities in it.
Trend trading is a trading strategy where traders aim to profit from the directional movements of an asset's price over an extended period.


-
 Afghanistan
-
 Albania
-
 Algeria
-
 Argentina
-
 Armenia
-
 Australia
-
 Austria
-
 Azerbaijan
-
 Bahamas
-
 Bahrain
-
 Bangladesh
-
 Belgium
-
 Botswana
-
 Brazil
-
 Brunei
-
 Bulgaria
-
 Burma
Burma
-
 Cambodia
-
 Cameroon
-
 Canada
-
 Chile
Chile
-
 China
China
-
 Colombia
-
 Costa Rica
-
 Cote d'Ivoire
-
 Croatia
-
 Cyprus
-
 Czech Republic
-
 Denmark
-
 Dominican Republic
-
 Ecuador
-
 Egypt
Egypt
-
 Estonia
-
 Eswatini
-
 Ethiopia
-
 Finland
-
 France
-
 Georgia
-
 Germany
-
 Ghana
Ghana
-
 Greece
-
 Haiti
Haiti
-
 Hong Kong
-
 Hungary
-
 India
India
-
 Indonesia
-
 Iran, Islamic republic
-
 Iraq
Iraq
-
 Ireland
-
 Israel
-
 Italy
Italy
-
 Jamaica
-
 Japan
Japan
-
 Jordan
-
 Kazakhstan
-
 Kenya
Kenya
-
 Korea
Korea
-
 Kuwait
-
 Kyrgyzstan
-
 Laos
Laos
-
 Latvia
-
 Lebanon
-
 Libyan Arab Jamahiriya
-
 Lithuania
-
 Luxembourg
-
 Macedonia
-
 Madagascar
-
 Malaysia
-
 Malta
Malta
-
 Mauritius
-
 Mexico
-
 Moldova
-
 Mongolia
-
 Montenegro
-
 Morocco
-
 Mozambique
-
 Namibia
-
 Nepal
Nepal
-
 Netherlands
-
 Nigeria
-
 Norway
-
 Oman
Oman
-
 Pakistan
-
 Palestine
-
 Papua New Guinea
-
 Peru
Peru
-
 Philippines
-
 Poland
-
 Portugal
-
 Puerto Rico
-
 Qatar
Qatar
-
 Romania
-
 Rwanda
-
 Saudi Arabia
-
 Serbia
-
 Singapore
-
 Slovakia
-
 Slovenia
-
 Somalia
-
 South Africa
-
 Spain
Spain
-
 Sri Lanka
-
 Sweden
-
 Switzerland
-
 Syrian Arab Republic
-
 Taiwan
-
 Tajikistan
-
 Tanzania, United Republic Of
-
 Thailand
-
 Trinidad and Tobago
-
 Tunisia
-
 Turkey
-
 UAE
UAE
-
 Uganda
-
 Ukraine
-
 United Kingdom
-
United States
-
 Uzbekistan
-
 Venezuela
-
 Vietnam
-
 Yemen
Yemen
-
 Zambia
-
 Zimbabwe
- Forex
- Crypto
