How To Trade Using Order Blocks


Editorial Note: While we adhere to strict Editorial Integrity, this post may contain references to products from our partners. Here's an explanation for How We Make Money. None of the data and information on this webpage constitutes investment advice according to our Disclaimer.
An order block is a term used in liquidity analysis to describe the concentration of trading orders placed by large market participants:
In Level 2 order books. This is the primary meaning. It refers to the price levels where traders place limit orders with high total volumes
On market profiles. Sometimes, the term “order block” refers to the levels at which trades with high total volumes were executed
Order block is a sign of presence of large players in the market, who need active liquidity. These are the price zones where "market whales" manipulated the price and where some of their orders are in drawdown at the moment. This is their shadow "trace" - open positions that should be closed. Prices will definitely return to these levels and we can prepare for that. So for us the Order Block zone is a level for entry or exit.
The concept of order blocks comes from supply and demand analysis in order books (Level 2 data). Traders focus on assessing the changes in supply and demand that cause even the slightest price fluctuations, thereby getting a competitive advantage over other market participants.
The problem is that such thorough analytical work is rather complicated – much more complicated than searching for moving average crossovers. Moreover, the internet offers little expert content on order block trading with chart examples. In this post, I will share valuable information, including trading examples with detailed descriptions, that will be useful for those who want to know what order blocks are.
Example of an order block
Here is what order blocks on a Bitcoin chart look like:
 Order blocks on a chart
The brighter and bolder the lines that mark the levels, the larger the order blocks. In this case, the bold red lines mark the most evident order blocks.
The number 1 shows a current buy order block:
The Depth of Market indicator on the right displays an evident spike. It means that market participants are ready to buy a large number of Bitcoins at $60,400 per coin. Regular (retail, small) market participants cannot bid such an amount or create a pronounced spike on the indicator.
The order block stays at the $60,400 level during the whole time displayed on the chart, which can be interpreted as a steady interest.
The number 2 shows an order block that worked. The price descended to the $60,500 level where a buy order block was placed. After all the orders were executed (the large player accumulated a long position), the price went up.
If you plan to apply order block analysis in real trading, choosing a reliable broker with transparent execution and access to Level 2 data is crucial. The table below compares some of the best Forex brokers that support advanced market depth tools, low spreads, and fast execution — essential for order flow and liquidity-based strategies.
| Demo | Min. deposit, $ | Max. leverage | Standard EUR/USD spread | ECN Spread EUR/USD | Max. Regulation Level | TU overall score | Open an account | |
|---|---|---|---|---|---|---|---|---|
| Yes | 10 | 1:1000 | 0.3 | 0.1 | Not regulated | 8.05 | Go to broker Your capital is at risk.
|
|
| Yes | 100 | 1:300 | 0.7 | No | Tier-1 | 7.57 | Go to broker 80% of retail CFD accounts lose money. |
|
| Yes | No | 1:200 | 0.3 | 0.15 | Tier-1 | 6.89 | Go to broker Your capital is at risk. |
|
| Yes | 50 | 1:50 | 1.1 | No | Tier-1 | 6.15 | Go to broker Your capital is at risk. |
|
| Yes | 100 | 1:50 | 1.0 | 0.2 | Tier-1 | 6.87 | Study review |
How to confirm an order block
In my opinion, to confirm an order block, it is more rational to use classic volume indicators (or Deltas) and price action patterns:
Vertical volume indicators (under the value area) directly confirm that the limit orders have been filled, signifying the satisfaction of institutional participants’ interest. The Delta indicator provides more details.
Price action patterns help confirm the price’s reactions and make trading decisions – for example, to enter a position expecting that it will be in harmony with a large market participant’s actions.
I mean if you trade reversals from order blocks, confirmation tools should help you make sure that a reversal is really happening and you have a reference point to make a trading decision.
Also, to make sure that an order block is strong, it is important to monitor its behavior over time. The order block should not become thinner when the price nears it. Thus, you confirm that the large player is confident about his intention.
But no matter how big it is, an order block can never guarantee that the price will bounce off it and the market trend will change.
How to trade order blocks
Order blocks can be traded in various ways. In this post, I offer three approaches:
Reversal;
Breakout;
Driving.
But you can explore charts more thoroughly using depth of market analysis tools to build your own, more versatile strategies with unique trading rules.
All the screenshots below are from the ATAS platform that I discussed here: ATAS Review: The Order Flow Trading Platform's Pros and Cons.
Order block trading strategy # 1 – Reversal
A reversal is a trend change – it’s often short-term, but sometimes lasts longer – that occurs after the price interacts with an order block.
Here is an example of trading a reversal from an order block:
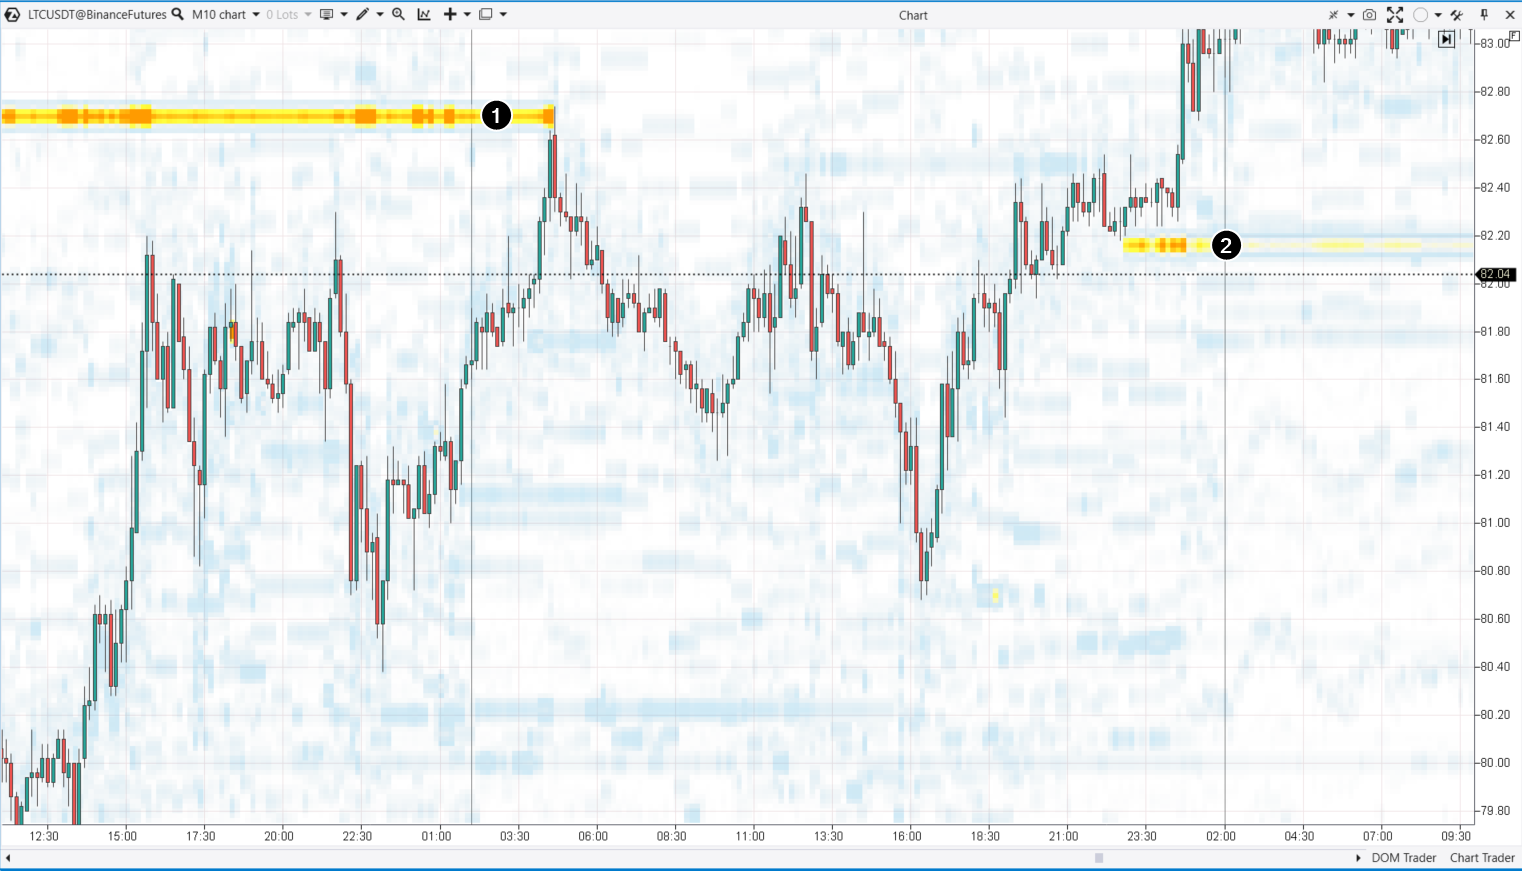 Order blocks on an LTC/USD chart
A buy order block (1) placed at 82.70 made the price reverse and descend as soon as it touched the 82.70 level. The bold line disappeared, which means the large player fulfilled his intention to enter a short position. The large size of his trade changed the sentiment and established a short-term trend.
The number 2 shows a demand driving signal that will be considered later.
How to trade reversals from order blocks
When you see the price approaching an order block, be ready to enter a position on clear signals that the trend is changing. You can:
use the oscillators you prefer;
simply place your orders next to the large player’s orders using stop losses as insurance and remembering that nobody can guarantee a future price movement or resist the whole market.
Order block trading strategy # 2 – Breakout
Below is an example of an order block breakout.
 An order block breakout on an ETH/USDchart
The chart shows that a buy order block was placed near a psychological level of 2000. However, the downward impulse was strong enough for the price to break through the large buy orders and keep dropping.
Here traders could join the downward impulse. On a lower timeframe, you would clearly see that as the price broke through the order blocks, its movement formed a bounce trajectory shown by the black arrow.
Traders could use it to find short position entry points:
at the top of the bounce after the first contact with the order blocks;
at the downward breach of the first bottom followed by the bounce.
Whichever approach you apply, it is important to protect your capital so that possible mistakes that nobody can be insured against will not entail extremely negative consequences.
Order block trading strategy # 3 – Driving
The chart below shows what price driving is. In simple terms, when a large player places large orders above and below the price, he thereby influences the sentiment and can capitalize on it.
If the large player wants the price to go down, he will place a large sell order. The other market participants will see this order and will probably want to enter short positions as well, pushing the price down with their sells. This way, the large player will achieve his goal.
 Trend driving on a BTC/USD chart
The number 1 on a 10-minute Bitcoin price chart above, shows that the large sell orders near 61750-61800 prompted selling and stopped the upward impulse that started at 01:40.
The number 2 shows that the large sell orders resulted in a bearish breach of the 61440 short-term support. Then, this level was tested.
The number 3 shows the driving of demand followed by the active buying of Bitcoin, a price rise, and a breach of the 61750-61800 resistance area.
Order block trading – One more example
Sometimes, the term “order block” refers to price levels with high volumes on the Market Profile indicator.
Essentially, order blocks in order books displayed by the Depth of Market indicator are the orders that appear on the Market Profile indicator after execution. In other words, high volume levels on the Market Profile are practically the same order blocks, but they are already executed.
 Order blocks on a profile indicator
 But as sellers overcame the support, the price dropped lower and the volumes moved from the order book to a high volume level on the profile indicator. Later, this level effectively worked as resistance, which is shown by the numbers 2 and 3.
Is order block trading profitable?
Yes, it can be profitable if your interpretation of the interaction between the price and order blocks is mostly correct. Order block trading requires proper discipline.
- Pros
- Cons
- More accurate identification of the price levels that really matter due to the placement of large orders that reflect the interests of important market participants.
- Improvement of the risk/reward ratio.
- Applicable to various markets for intraday trading
- Indicators are the source of raw market data that is provided in real time and does not change.
- Interpreting Level 2 data is complicated.
- Order blocks cannot be used for investing because they are displayed on low-scale charts ignored by long-term investors.
- Real-time reception of exchange data may require the use of paid software and services.
- It is difficult to establish trading algorithms when analyzing history. The ever-changing market requires you to analyze it yourself rather than use advisors that work by simple “if–then” rules.
Advice:
The ATAS platform has the Market Replay feature allowing you to use past data to trade order blocks in training mode without risking real funds.
As someone who has worked with order flow analysis for years, I see order block trading as a discipline that demands both patience and precision. My recommendation to traders is not to rush into identifying order blocks as simple “zones of reversal.” Instead, treat them as dynamic footprints of institutional behavior that evolve with liquidity conditions. An order block is not a fixed level – it’s a reflection of intent. When you learn to interpret how that intent changes over time, you start to see where the real opportunities lie.
In my practice, I always monitor the consistency of the block: does the volume remain stable as the price approaches, or does it thin out? This detail alone can determine whether the level will hold or collapse. I also emphasize confirmation – watch how the Delta, cumulative volume, or footprint reacts when price touches that zone. If the big player is still active, the reaction will be immediate.
Most traders fail not because order block theory doesn’t work, but because they use it in isolation. It must be integrated with broader liquidity concepts, such as trapped volume, imbalance zones, and real-time order flow. Only then does it become a true edge rather than a pattern-hunting exercise. My advice: treat every order block as a hypothesis about large-player behavior, not as a guarantee of reversal. If you can maintain that mindset, order block trading becomes a reliable framework for understanding – not predicting – the market.
Conclusion
Order blocks serve as essential markers for identifying significant support and resistance levels, empowering traders to anticipate market moves more accurately. By leveraging order flow analysis with specific indicators, traders can highlight zones where institutional activity is likely to influence price direction. For instance, recognizing an order block before a breakout or a reversal can enable more strategic entry and exit points. Ultimately, integrating order block analysis into your trading toolkit can provide a decisive edge—turning hidden market footprints into actionable opportunities.
FAQs
What tools or indicators are most effective for confirming the strength of an order block?
How can traders manage risk when trading based on order blocks?
Are order block strategies suitable for long-term investing?
What challenges do traders face when using order block analysis in live markets?
Editors' Top Picks and Insights

SK Hynix debuts on Nasdaq: Largest U.S. offering by foreign company

SpaceX falls out of orbit: Does anyone still want Musk’s stock?

The crypto IPO problem: How high-profile listings became investor traps

U.S. Bitcoin reserve: Trump’s unrealized crypto promise

Aiming for leadership: Payment giants prepare a new stablecoin

Proof of Reserves: the new standard for cryptocurrency exchanges
Related Articles
Team that worked on the article
Andrey Mastykin is an experienced author, editor, and content strategist who has been with Traders Union since 2020. As an editor, he is meticulous about fact-checking and ensuring the accuracy of all information published on the Traders Union platform.
Dan Blystone began his trading career in 1998 as an arbitrage clerk on the floor of the Chicago Mercantile Exchange (CME). He later traded bond and Eurex futures at proprietary firms such as Altea Trading, gaining valuable experience in high-frequency trading and risk management.
Chinmay Soni is a financial analyst with more than 5 years of experience in working with stocks, Forex, derivatives, and other assets. As a founder of a boutique research firm and an active researcher, he covers various industries and fields, providing insights backed by statistical data.
Day trading involves buying and selling financial assets within the same trading day, with the goal of profiting from short-term price fluctuations, and positions are typically not held overnight.
In the Forex market, a “trend” is the label used to describe the general direction that the prices of currency pairs are moving in, over a specific period of time. Trends are basically the pattern that a currency pair appears to be following and can help traders determine when to enter and exit a trade.
Cryptocurrency is a type of digital or virtual currency that relies on cryptography for security. Unlike traditional currencies issued by governments (fiat currencies), cryptocurrencies operate on decentralized networks, typically based on blockchain technology.
Social trading is a form of online trading that allows individual traders to observe and replicate the trading strategies of more experienced and successful traders. It combines elements of social networking and financial trading, enabling traders to connect, share, and follow each other's trades on trading platforms.
CFD is a contract between an investor/trader and seller that demonstrates that the trader will need to pay the price difference between the current value of the asset and its value at the time of contract to the seller.

-
 Afghanistan
-
 Albania
-
 Algeria
-
 Angola
-
 Argentina
-
 Armenia
-
 Australia
-
 Austria
-
 Azerbaijan
-
 Bahamas
-
 Bahrain
-
 Bangladesh
-
 Belarus
-
 Belgium
-
 Bolivia
-
 Botswana
-
 Brazil
-
 Brunei
-
 Bulgaria
-
 Cambodia
-
 Cameroon
-
 Canada
-
 Chile
Chile
-
 China
China
-
 Colombia
-
 Congo
Congo
-
 Costa Rica
-
 Cote d'Ivoire
-
 Croatia
-
 Cuba
Cuba
-
 Cyprus
-
 Czechia
-
 DR Congo
-
 Denmark
-
 Dominican Republic
-
 Ecuador
-
 Egypt
Egypt
-
 El Salvador
-
 Estonia
-
 Eswatini
-
 Ethiopia
-
 Finland
-
 France
-
 Georgia
-
 Germany
-
 Ghana
Ghana
-
 Greece
-
 Haiti
Haiti
-
 Hong Kong
-
 Hungary
-
 India
India
-
 Indonesia
-
 Iran, Islamic republic
-
 Iraq
Iraq
-
 Ireland
-
 Israel
-
 Italy
Italy
-
 Jamaica
-
 Japan
Japan
-
 Jordan
-
 Kazakhstan
-
 Kenya
Kenya
-
 Korea
Korea
-
 Kuwait
-
 Kyrgyzstan
-
 Laos
Laos
-
 Latvia
-
 Lebanon
-
 Lesotho
-
 Libya
Libya
-
 Lithuania
-
 Luxembourg
-
 Madagascar
-
 Malaysia
-
 Malta
Malta
-
 Mauritius
-
 Mexico
-
 Moldova
-
 Mongolia
-
 Montenegro
-
 Morocco
-
 Mozambique
-
 Myanmar
-
 Namibia
-
 Nepal
Nepal
-
 Netherlands
-
 New Zealand
-
 Nigeria
-
 North Macedonia
-
 Norway
-
 Oman
Oman
-
 Pakistan
-
 Palestine
-
 Panama
-
 Papua New Guinea
-
 Paraguay
-
 Peru
Peru
-
 Philippines
-
 Poland
-
 Portugal
-
 Puerto Rico
-
 Qatar
Qatar
-
 Reunion
-
 Romania
-
 Rwanda
-
 Saudi Arabia
-
 Serbia
-
 Singapore
-
 Slovakia
-
 Slovenia
-
 Somalia
-
 South Africa
-
 Spain
Spain
-
 Sri Lanka
-
 Sweden
-
 Switzerland
-
 Syria
Syria
-
 Taiwan
-
 Tajikistan
-
 Tanzania
-
 Thailand
-
 Trinidad and Tobago
-
 Tunisia
-
 Turkey
-
 UAE
UAE
-
 Uganda
-
 Ukraine
-
 United Kingdom
-
United States
-
 Uruguay
-
 Uzbekistan
-
 Venezuela
-
 Vietnam
-
 Yemen
Yemen
-
 Zambia
-
 Zimbabwe
- Forex
- Crypto
