Top Volume Indicators In Trading


Editorial Note: While we adhere to strict Editorial Integrity, this post may contain references to products from our partners. Here's an explanation for How We Make Money. None of the data and information on this webpage constitutes investment advice according to our Disclaimer.
Best volume indicators in trading:
Volumes. Shows activity of the market players and the number of transactions performed by them;
Money Flow Index (MFI). Shows the rate at which the money flows into and out of an asset;
On Balance Volume (OBV). Compares the current and previous closing prices;
Accumulation/Distribution Indicator (A/D) — developed based on the On Balance Volume;
Volume Weighted Average Price (VWAP). One of the derivative indicators of moving averages that takes into account trading volumes;
Chaikin Oscillator. A derivative of A/D indicator, which uses the values of moving averages.
Market volumes are often ignored by novice traders; they are rarely used in trading strategies, and therefore, an impression is formed that they are not necessary, as trend indicators and oscillators complement each other well. An understanding that this is a delusion comes with experience. There is a notion of Volume Spread Analysis (VSA) in professional trading, which stands apart from classical technical analysis and chart systems of Price Action patterns.
In this review you will learn:
What volumes are in trading and why they need to be considered in strategies.
What indicators are the best for assessing the volumes.
What similar instruments are; their pros and cons.
Best volume indicators in trading
There are horizontal and vertical volumes in trading:
Horizontal volumes show the volume of closed positions at a certain price level. If the volume of transactions is steadily growing at a certain price, that means that this level is the key support or resistance level for the majority.
Vertical volumes show the volume of closed positions over a certain period of time. If the volumes are increasing in the time period, it indicates that the interest of investors towards an asset is growing, the volatility is increasing as is the strength of the trend. Growth of volumes is often accompanied by the breakout of the key support and resistance levels.
The majority of standard indicators of trading platforms assess the vertical market volumes.
Volumes
This is a classic indicator showing activity of the market players and the number of transactions performed by them. It is drawn under the price as a histogram. The green color of the bar indicates that the volume of the current candle is higher than the volume of the previous candle. If the volume of the current candle is lower, the bar is red.
Calculation formula: volume = number of closed positions over the selected period of time.
Indicator signals:
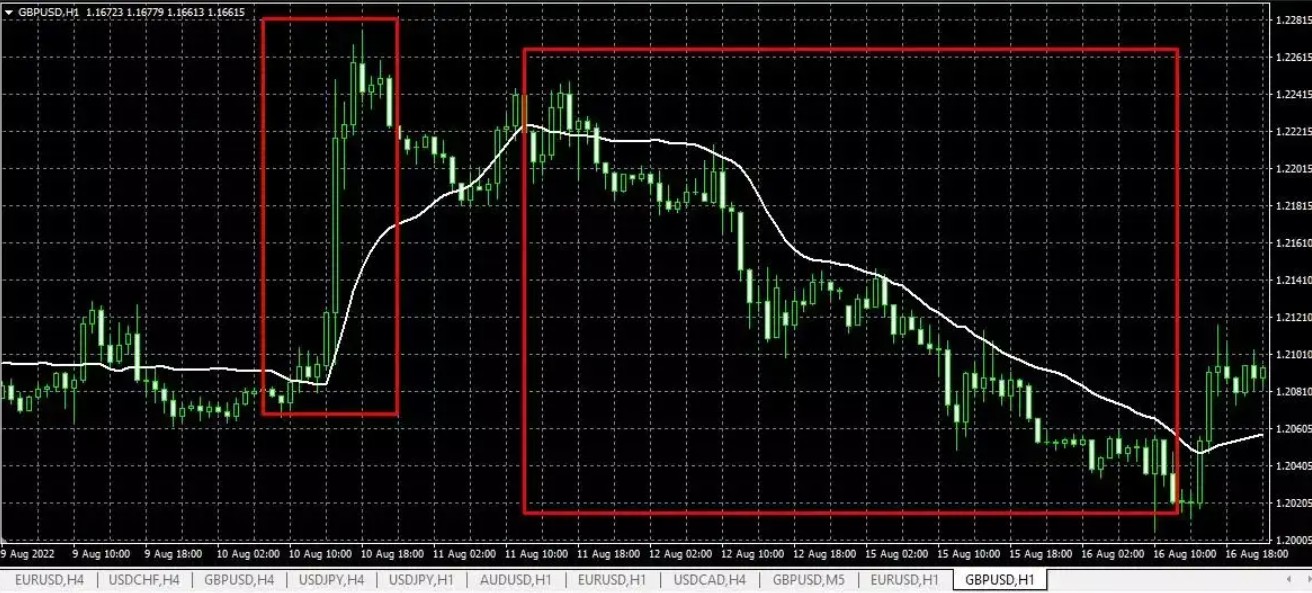
Consistent growth of the bars may indicate increase in volumes, thereby confirming the strength of the upward or downward trend.
Abnormally high volumes (high bars of the histogram) may indicate an end of the trend.
A sharp surge of volumes may point to a local correction with subsequent continuation of the trend.
Sequential red bars in an upward trend may indicate that market makers are artificially supporting an upward trend when volumes are dropping. It is possible that the trend will soon end.
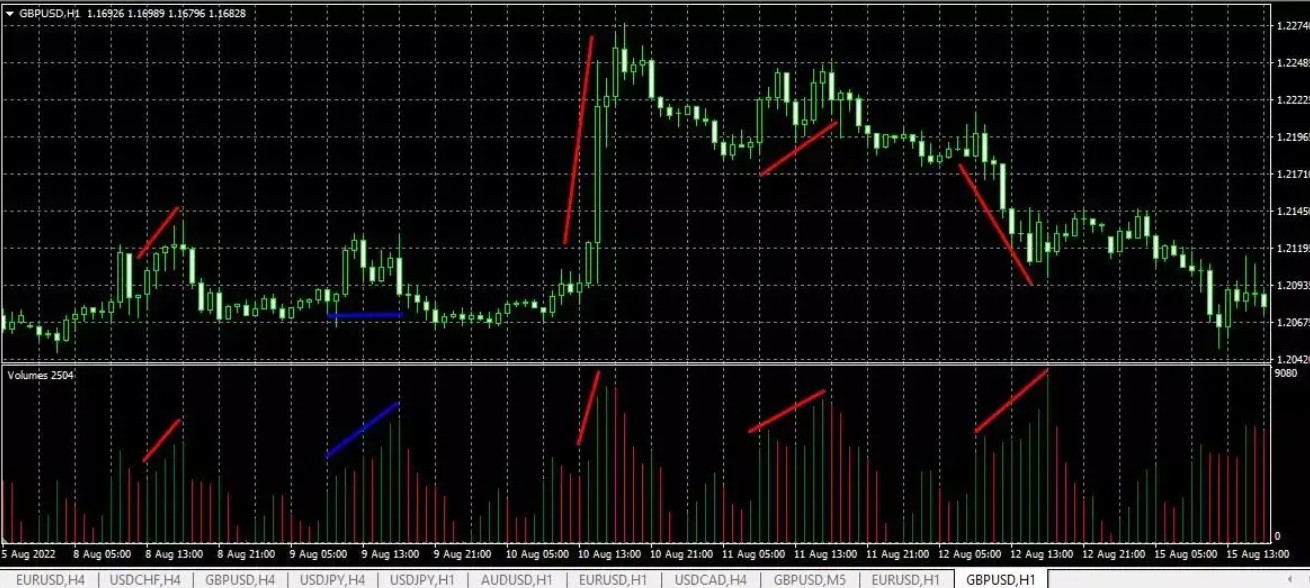
Nearly in all areas of big growth of volumes, a trend movement of a certain strength is observed. The indicator practically does not have settings, and therefore requires additional signal confirmation.
Money Flow Index (MFI)
Money Flow Index is an indicator that shows the rate at which the money flows into and out of an asset. The principle of interpreting the indicator signals is similar to the RSI, with the only difference that volumes are also taken into account in MFI.
Calculation formula:
Money Flow = Typical Price * Volume. Typical price is the arithmetic average of the Max, Min, Close prices.
Calculation of money flow. If the typical price of the current candle is higher than the previous one, the flow is positive, and if it is lower, the flow is negative.
MR = Positive flow/Negative flow. Before calculation, all flows in the numerator and denominator are summed. The number of flows corresponds to the period specified in the settings.
MFI = 100 – (100/(1-MR)).
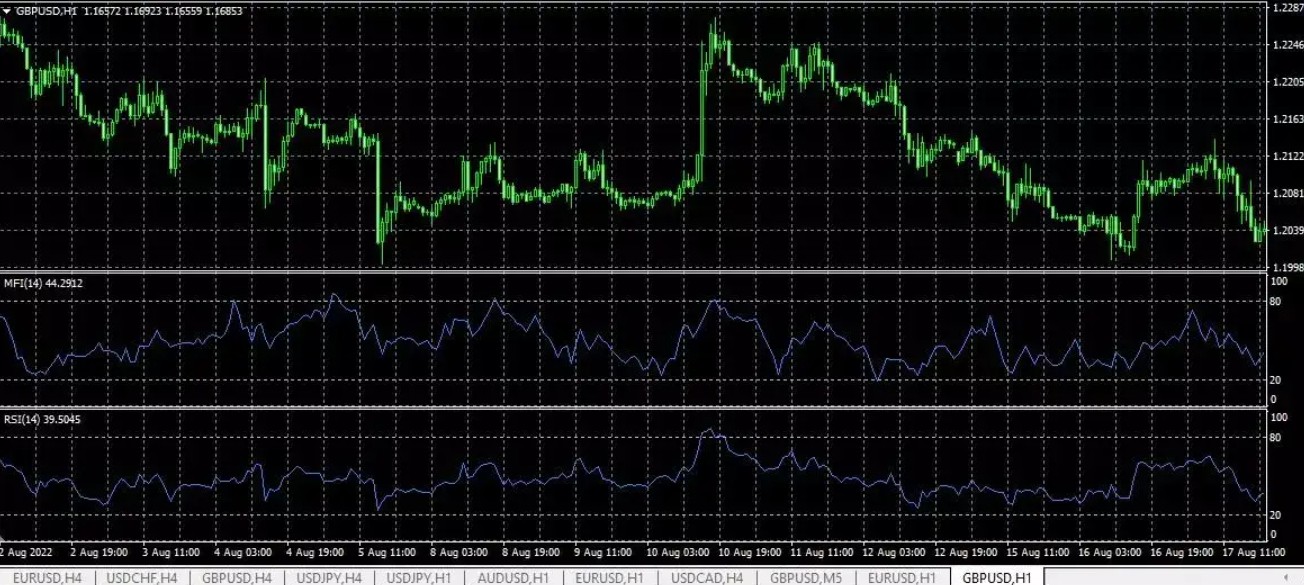
MFI is the top indicator, and RSI is the bottom one. You can see on the chart that the MFI reacts more sharply to strong movements, while RSI looks more even. The signals of both indicators are the same: exit from the overbought/oversold zone – price reversal; sharp surges – strong trend movement, divergence – price reversal in the direction of the trend, breakout of the zero level – trend confirmation. The indicators also give false signals, so you need to adjust the period for the specific asset and filter them with other instruments.
On Balance Volume (OBV)
This is one of the best trading volume indicators. It links the volume and the price change that accompanied that volume. The value of the indicator is calculated as follows. OBV indicator compares the current and previous closing prices. If the current closing price is higher, the current volume is added to the previous one, and if it's lower, the current volume is subtracted, and if it is equal, the value of the volume does not change.
Main indicator signals:
Trend confirmation. The price is moving up together with the indicator line – the trend is confirmed.
Divergence. The divergence between the indicator value and the price. The indicator is leading, therefore, in the event of a divergence, a price reversal should be expected in the direction of the indicator.
Breakout of a strong, visible horizontal level by the indicator, sharp movement up or down.
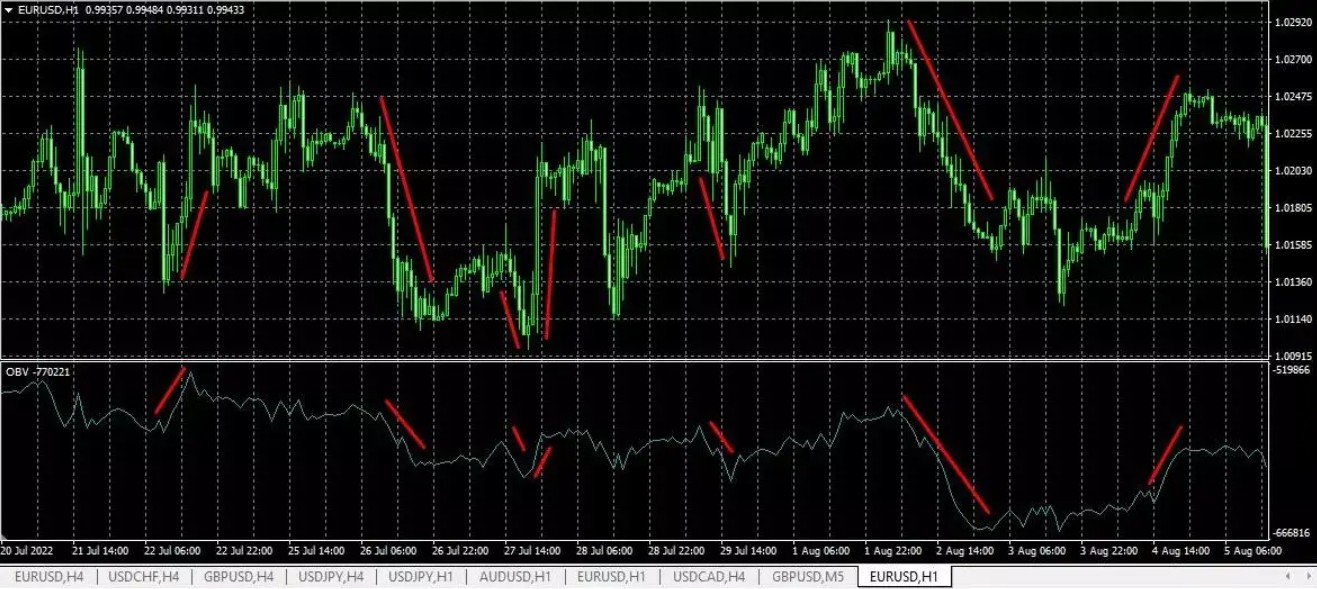
On a smaller scale, you can see that the indicator confirms strong trends. However, strong movements need to be compared to the previous intervals. Exit of the indicator from its standard movement corridor is a strong confirming signal.
Accumulation/Distribution Indicator (A/D)
The indicator was developed based on the On Balance Volume and has a lot in common with it. It also takes into account the volume value of the previous candle.
Calculation formula: A/D(i) = ((Closing price (i) – Low(i)) – (High(i) – Closing price (i)) * Volume(i) / (Low.(i) – High (i)) + A/D(i-1)
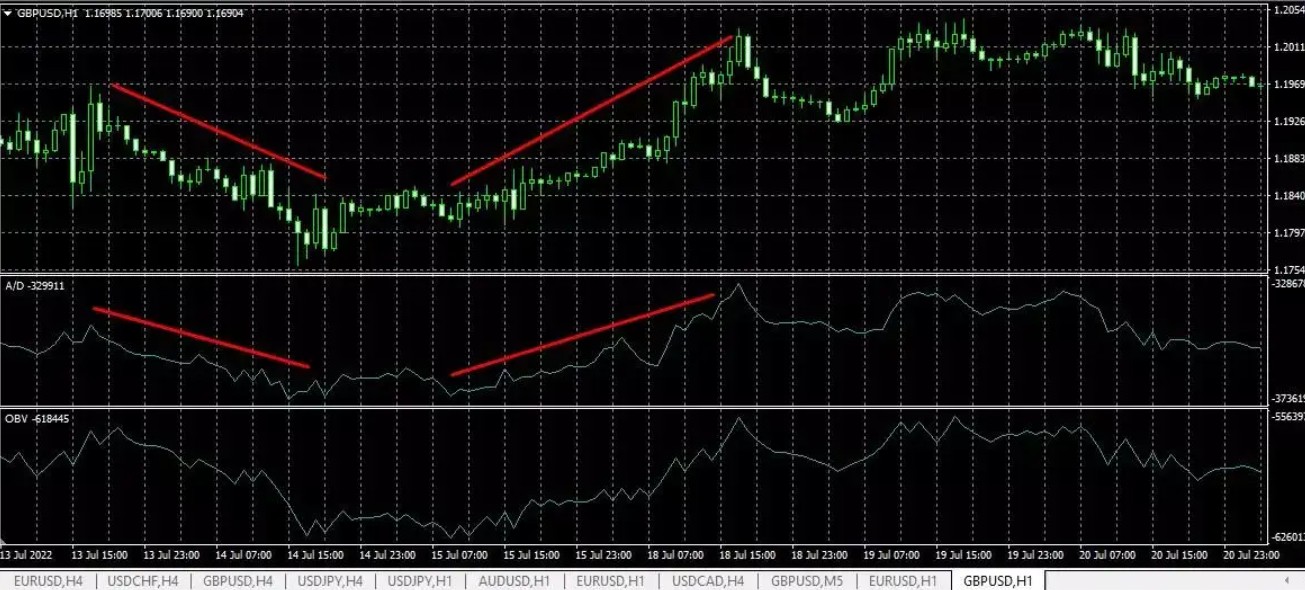
A/D indicator is the top chart and OBV is the bottom one. On the long-term trend, they show the same signals, with slight differences on local corrections.
Volume Weighted Average Price (VWAP)
Volume Weighted Average Price is one of the derivative indicators of moving averages that takes into account trading volumes. The indicator averages the prices for the specified period, taking into account the trading volumes of each price area (candlestick) for the period selected in the settings. It is not included in the standard set of indicators.
Calculation formula: SUM (Volume*Price)/SUM Volume
By default, Price is typical price, which is calculated as (High price + Low price + Closing Price)/3
Indicator signals:
Location of the price relative to the indicator line. The price above the indicator for a long time indicates an upward trend, below – a downward trend. The further the price moves away from the trend line, the more likely the price will reverse.
Breakout of the indicator line by the price upwards indicates an upward trend, down – a downward trend. Patterns and other instruments are used to confirm the signal. If the price crosses VWAP several times, without moving away from the indicator line, the market is flat.
The indicator shows long-term trends well. It is used only as an auxiliary indicator, confirming signals. One of the strategy options is to add several VWAP indicators with different periods and look for their convergence/divergence ranges. The narrowing of all VWAPs is a signal for the beginning of a new trend.
Chaikin Oscillator
This is a non-standard oscillator that is a derivative of A/D indicator, which uses the values of moving averages. Calculation formula: the difference of exponential moving averages, which are built from the current value of A/D. EMAs have different periods – by default, there is a difference between the fast EMA(3) and the slow EMA(10). The strongest signal is when the oscillator reaches its previous extremes with a subsequent reversal. This means that the indicator could not break the previous value and is reversing.
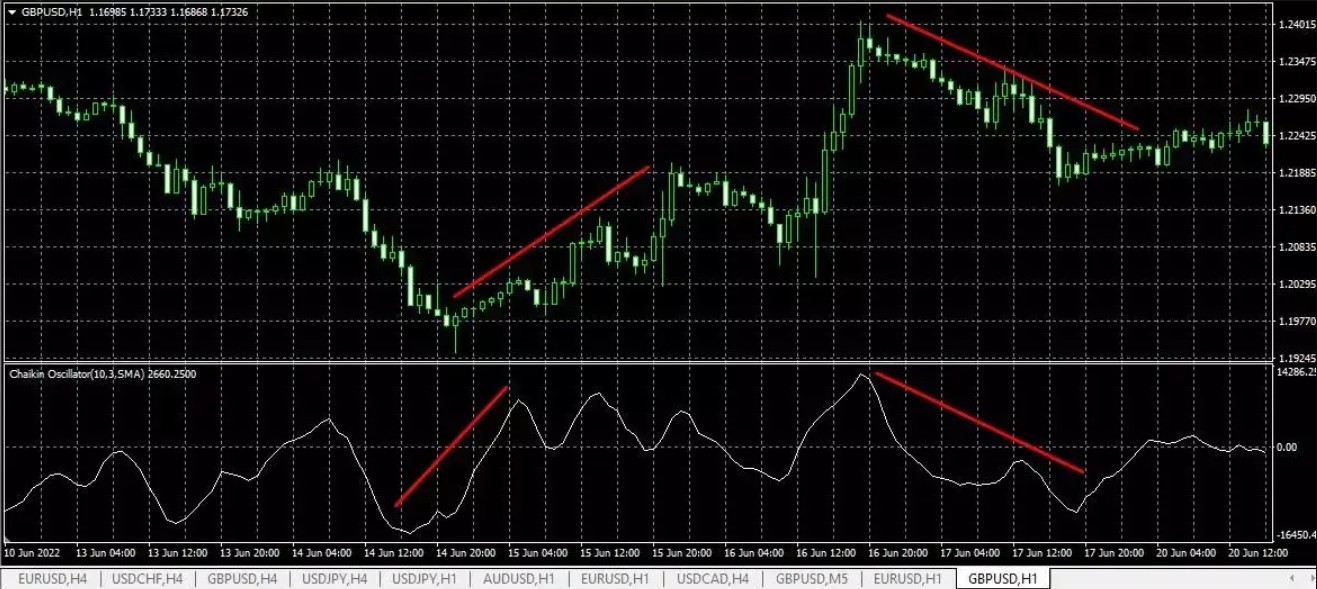
Without selection of settings, the indicator gives many false signals. Note that only oscillator movements from its highs/lows are taken into account.
The notion of market volumes in trading
The market price changes when the supply/demand balance shifts to one side. For example, there are buyers who are prepared to buy 10 units of an asset at USD 100. However, the sellers are prepared to sell only 3 units for this price. The sellers then raise the price to USD 120. For this price, the buyers are prepared to buy only 5 units. The sellers raise the price to USD 130, and the buyers are ready to buy only 3 units of an asset. The market is in balance.
Question. Do you think the trading volume matters in this case? Does it matter how many units of an asset move the price from USD 100 to USD 130: 10 units or 10,000 units? Or is it only the fact that the price increased by 30 USD that matters?
Here’s the answer to this question in several parts:
Considering volumes is important, but not always necessary. A lot depends on the strategy. Standard indicators are built on the statistics of past periods, where volume changes are already automatically included. On the other hand, a change of the volume may indicate a temporary pause or, conversely, increase of activity of traders, i.e. a confirming signal.
On short-term intervals, volume indicators are less effective than on long-term ones. A sharp increase in the transaction volume on the M1 timeframe may indicate that a major market maker has entered the market, interested in short-term speculation. In the long term, market makers do not have such a significant impact on the market.
Volumes are more important in the stock market than in the Forex market.
Note! Exchanges (stock, Forex) and OTC (CFD) trading are the key markets for private investors. Exchange brokers have a different principle of calculating volumes than CFD brokers. At the exchange market, an exchange is an aggregator of information and as a direct participant of trading has access to trading volume data. In the OTC market, it is impossible to aggregate this information, and therefore a tick volume is calculated there. A tick is the change in price by 1 basis point.
Combining volume indicators with other tools
Combining volume indicators with other trading tools can significantly enhance your decision-making and help you gain higher conviction in your trades. Let’s look at the key considerations with respect to this idea:
Traders often rush into breakouts without checking volume. To make sure a breakout is for real, combine volume with trend indicators like Moving Averages or the ADX. When you see volume surge alongside a price breakout, it confirms strong momentum, making the breakout more reliable and increasing the chances of a sustained move.
Check for volume surges in overbought/oversold zones. Pair volume indicators with oscillators like RSI or Stochastic. When volume increases while the oscillator is in the overbought or oversold zone, it could signal that a reversal is near. For example, a rising RSI in the overbought zone with a volume spike might show that buying pressure is fading.
Combine volume with volatility indicators to manage risk. Volume paired with volatility indicators like Bollinger Bands or ATR helps you gauge market strength and manage risk. If the price moves toward the outer bands with rising volume, it could signal an explosive move. This combination helps set smarter stop-loss levels based on how volatile the market is.
Use volume to double-check support/resistance. Volume is key for confirming whether support or resistance levels will hold. When price nears a major level and volume increases, it's often a sign the level will either break or hold with more conviction. Combining volume with support and resistance helps you time your entries and exits more effectively.
Add volume to candlestick patterns for more confidence. Candlestick patterns are more reliable when backed by volume. For example, a bullish engulfing pattern with rising volume signals strong buying interest. The added volume confirms the pattern, giving you more confidence that the move will hold.
Best brokers 2025
Choosing the right broker is crucial for effective trading, especially when using volume indicators. In this section, we highlight the top brokers of 2025, focusing on their features, trading platforms, and support for advanced analytical tools to help you maximize your trading potential.
| Demo | Min. deposit, $ | Max. leverage | Min Spread EUR/USD, pips | Max Spread EUR/USD, pips | Negative balance protection | Investor protection | Max. Regulation Level | Open an account | |
|---|---|---|---|---|---|---|---|---|---|
| Yes | 100 | 1:300 | 0,5 | 0,9 | Yes | €20,000 £85,000 SGD 75,000 | Tier-1 | Open an account Your capital is at risk. |
|
| Yes | No | 1:500 | 0,5 | 1,5 | Yes | £85,000 €20,000 €100,000 (DE) | Tier-1 | Open an account Your capital is at risk.
|
|
| Yes | No | 1:200 | 0,1 | 0,5 | Yes | £85,000 SGD 75,000 $500,000 | Tier-1 | Open an account Your capital is at risk. |
|
| Yes | 100 | 1:50 | 0,7 | 1,2 | Yes | £85,000 | Tier-1 | Study review | |
| Yes | No | 1:30 | 0,2 | 0,8 | Yes | $500,000 £85,000 | Tier-1 | Open an account Your capital is at risk. |
Risks and warnings
New traders often think volume spikes signal a breakout. However, high volume can happen during consolidation or fakeouts, leading to false signals. To avoid this, always pair volume spikes with other tools like price action to confirm whether the breakout is real.
Focusing too much on volume without seeing the bigger picture. Volume indicators give you valuable insights, but they’re most effective when you consider the market's overall trend. High volume during a trend often shows momentum, but in a range-bound market, it could just be noise. Check the broader trend and market sentiment before making a decision.
Thinking low volume means no market opportunities. Low volume doesn’t always indicate a quiet market. Sharp moves can still happen when low volume coincides with major news or events. Instead of avoiding low-volume conditions, be ready to act when you spot the right signals with your strategy.
Volume indicators can follow price action. Keep in mind that many volume indicators lag behind price movements, as they depend on past data. Don’t rely solely on volume signals for real-time entries; use them alongside price action or other indicators to make more informed decisions.
Using too many volume indicators can confuse you. Beginners often try to use multiple volume indicators, thinking more data gives them more clarity. This can actually make your analysis unclear. Stick to one or two volume indicators that work with your strategy, and pair them with other tools like trend lines to keep things simple and actionable.
Use volume indicators to spot reversals and validate breakouts in trading

One often ignored use of volume indicators is how they help you spot reversals. Volume doesn’t just tell you the strength of a trend; it also shows when that trend is losing power. Many beginners miss this and focus only on volume spikes during trending moves. But when you see a surge in volume during a pullback, it could indicate a reversal, giving you a chance to enter or exit the trade early. Combine volume with price action or candlestick patterns for an added layer of confirmation, as volume surges often precede significant price movements.
Another key tip is using volume to filter out false breakouts. Traders often jump into breakouts without checking volume. If the breakout happens with low volume, it may not hold. Instead, wait for the price to break through key levels with a volume surge — it’s more likely to be a strong move. Always check volume to confirm breakouts, as this can protect you from getting trapped in a false move that reverses quickly.
Conclusion
Volume indicators are essential tools for understanding market activity and enhancing trading strategies. By analyzing changes in volume, these indicators provide key insights into trend strength, potential reversals, and market momentum. Whether using standard tools like OBV or advanced options like Volume Profile, traders can combine these with other indicators to make more informed decisions and improve their trading outcomes.
FAQs
What is the difference between Volume Profile and standard volume indicators?
Volume Profile measures activity at specific price levels, while standard indicators like OBV or MFI analyze volume over time.
Can volume indicators predict price reversals?
While volume indicators cannot directly predict reversals, divergences between price movement and volume often serve as early warning signs.
What timeframe works best for volume analysis?
Longer timeframes (H1 and above) are generally more reliable for volume analysis, as they smooth out noise and provide a clearer picture of market activity.
Which indicator has the highest accuracy?
No single indicator guarantees accuracy; effectiveness varies with market conditions and trading strategies.
Related Articles
Team that worked on the article
Rinat Gismatullin is an entrepreneur and a business expert with 9 years of experience in trading. He focuses on long-term investing, but also uses intraday trading. He is a private consultant on investing in digital assets and personal finance. Rinat holds two degrees in Economy and Linguistics.
Chinmay Soni is a financial analyst with more than 5 years of experience in working with stocks, Forex, derivatives, and other assets. As a founder of a boutique research firm and an active researcher, he covers various industries and fields, providing insights backed by statistical data. He is also an educator in the field of finance and technology.
As an author for Traders Union, he contributes his deep analytical insights on various topics, taking into account various aspects.
Mirjan Hipolito is a journalist and news editor at Traders Union. She is an expert crypto writer with five years of experience in the financial markets. Her specialties are daily market news, price predictions, and Initial Coin Offerings (ICO).
CFD is a contract between an investor/trader and seller that demonstrates that the trader will need to pay the price difference between the current value of the asset and its value at the time of contract to the seller.
Scalping in trading is a strategy where traders aim to make quick, small profits by executing numerous short-term trades within seconds or minutes, capitalizing on minor price fluctuations.
Index in trading is the measure of the performance of a group of stocks, which can include the assets and securities in it.
Bollinger Bands (BBands) are a technical analysis tool that consists of three lines: a middle moving average and two outer bands that are typically set at a standard deviation away from the moving average. These bands help traders visualize potential price volatility and identify overbought or oversold conditions in the market.
Volatility refers to the degree of variation or fluctuation in the price or value of a financial asset, such as stocks, bonds, or cryptocurrencies, over a period of time. Higher volatility indicates that an asset's price is experiencing more significant and rapid price swings, while lower volatility suggests relatively stable and gradual price movements.


-
 Afghanistan
-
 Albania
-
 Algeria
-
 Argentina
-
 Armenia
-
 Australia
-
 Austria
-
 Azerbaijan
-
 Bahamas
-
 Bahrain
-
 Bangladesh
-
 Belgium
-
 Botswana
-
 Brazil
-
 Brunei
-
 Bulgaria
-
 Burma
Burma
-
 Cambodia
-
 Cameroon
-
 Canada
-
 Chile
Chile
-
 China
China
-
 Colombia
-
 Costa Rica
-
 Cote d'Ivoire
-
 Croatia
-
 Cyprus
-
 Czech Republic
-
 Denmark
-
 Dominican Republic
-
 Ecuador
-
 Egypt
Egypt
-
 Estonia
-
 Eswatini
-
 Ethiopia
-
 Finland
-
 France
-
 Georgia
-
 Germany
-
 Ghana
Ghana
-
 Greece
-
 Haiti
Haiti
-
 Hong Kong
-
 Hungary
-
 India
India
-
 Indonesia
-
 Iran, Islamic republic
-
 Iraq
Iraq
-
 Ireland
-
 Israel
-
 Italy
Italy
-
 Jamaica
-
 Japan
Japan
-
 Jordan
-
 Kazakhstan
-
 Kenya
Kenya
-
 Korea
Korea
-
 Kuwait
-
 Kyrgyzstan
-
 Laos
Laos
-
 Latvia
-
 Lebanon
-
 Libyan Arab Jamahiriya
-
 Lithuania
-
 Luxembourg
-
 Macedonia
-
 Madagascar
-
 Malaysia
-
 Malta
Malta
-
 Mauritius
-
 Mexico
-
 Moldova
-
 Mongolia
-
 Montenegro
-
 Morocco
-
 Mozambique
-
 Namibia
-
 Nepal
Nepal
-
 Netherlands
-
 Nigeria
-
 Norway
-
 Oman
Oman
-
 Pakistan
-
 Palestine
-
 Papua New Guinea
-
 Peru
Peru
-
 Philippines
-
 Poland
-
 Portugal
-
 Puerto Rico
-
 Qatar
Qatar
-
 Romania
-
 Rwanda
-
 Saudi Arabia
-
 Serbia
-
 Singapore
-
 Slovakia
-
 Slovenia
-
 Somalia
-
 South Africa
-
 Spain
Spain
-
 Sri Lanka
-
 Sweden
-
 Switzerland
-
 Syrian Arab Republic
-
 Taiwan
-
 Tajikistan
-
 Tanzania, United Republic Of
-
 Thailand
-
 Trinidad and Tobago
-
 Tunisia
-
 Turkey
-
 UAE
UAE
-
 Uganda
-
 Ukraine
-
 United Kingdom
-
United States
-
 Uzbekistan
-
 Venezuela
-
 Vietnam
-
 Yemen
Yemen
-
 Zambia
-
 Zimbabwe
- Forex
- Crypto
