
Comcast stock price forecast: $23.50–$24.25 range as CMCSA slips 3.46%

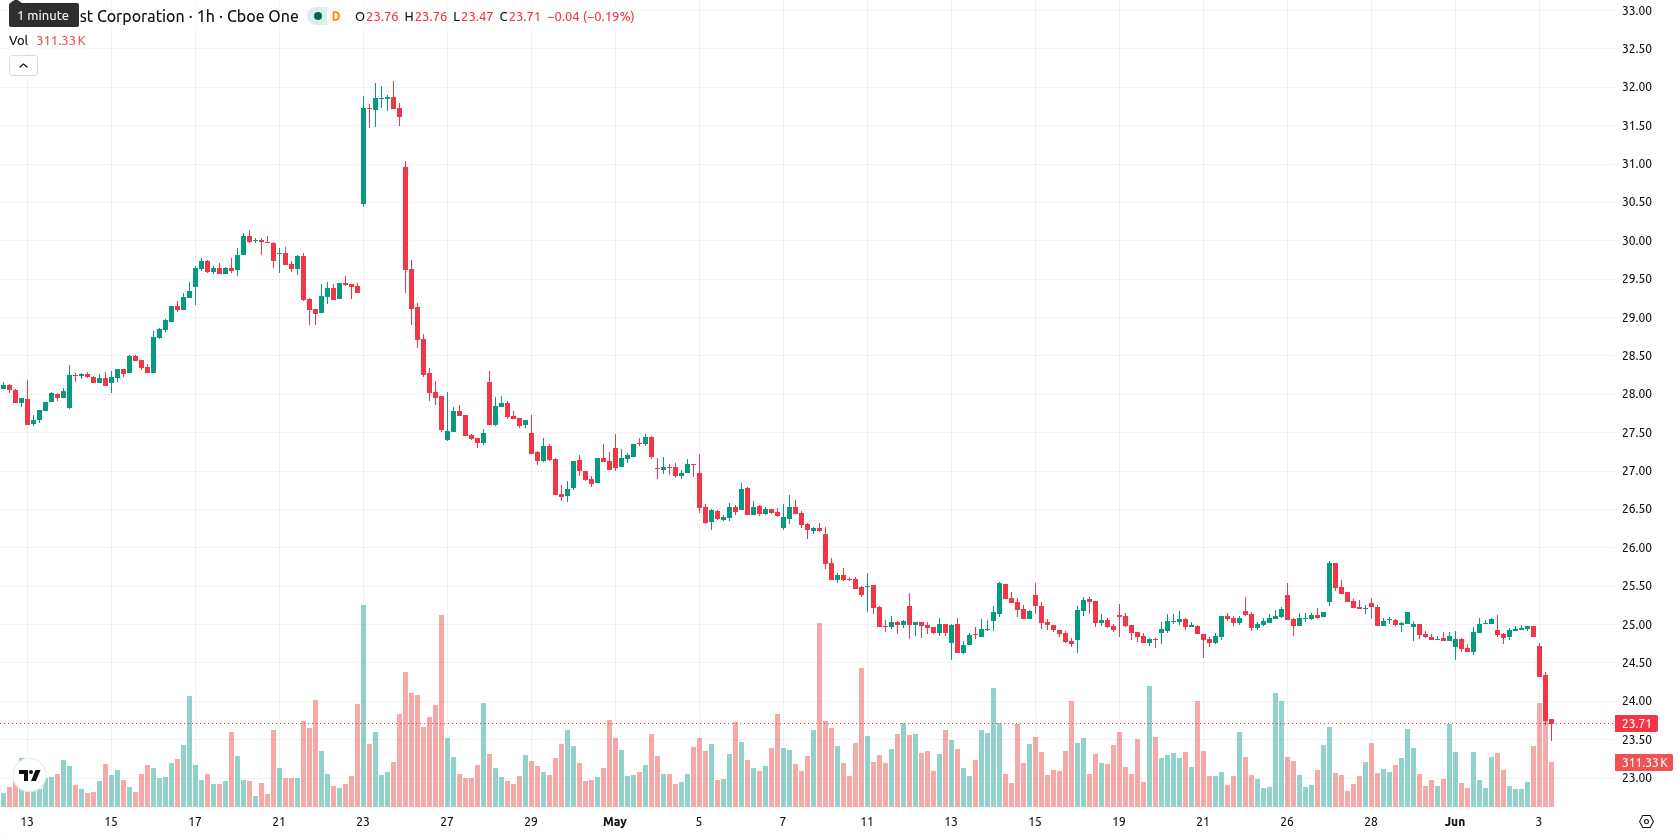
Comcast Corporation (CMCSA) stock is trading at $23.99, down 3.46% for the day. The price is positioned below its key moving averages, reflecting continued weakness in the short, medium, and long term.
Highlights
- Comcast increased its debt tender offer cap to $4.14 billion, advancing a large-scale liability management effort.
- The company maintains a dividend yield above 5%, sustaining attractive shareholder returns amid industry-wide selling pressure.
- Shares remain under persistent bearish momentum, trading below key moving averages with a high probability of further downside toward $23.50–$24.25.
Enhanced debt tender size signals capital shift amid persistent selloff
On June 3, 2026, Comcast increased the cap on its cash tender offers for various debt securities to $4.14 billion from $3.75 billion, reflecting a significant commitment to liability management and potentially enhancing its liquidity position. The company and its subsidiary Comcast Cable Communications, LLC also reported the results of these expanded tender offers, marking the closure of a substantial capital restructuring effort. Additionally, Comcast continues to provide a dividend yield above 5%, supporting shareholder returns, though price action has remained under broader selling pressure.
Extended downside momentum as resistance holds and buyers remain scarce
CMCSA is trading below the MA-20 ($25.23), MA-50 ($27.11), and MA-200 ($29.29) levels, highlighting unresolved downside momentum. The Ichimoku Kijun level at $26.42 represents the nearest technical resistance. MACD signals strong downward momentum, while ADX on both daily and weekly charts suggests weak overall trend strength. RSI readings (35.88 on the daily chart and 33.94 on the weekly) along with Stoch RSI and CCI indicate that the stock is not yet extremely oversold, but demand remains weak. BBP values are negative, forecasting further seller dominance intraday. The Awesome Oscillator is neutral, failing to confirm the current downtrend. The current trading range is $24.22 to $24.68, with continued selling pressure after the open and moderate volatility.
Low upside odds as weak demand drives base-case bearish scenario
Over the next five trading days, the projected price range for CMCSA is $23.50 to $24.25, representing a typical volatility band relative to current levels. The probability of a price increase is assessed as low (less than 20%), making continued weakness the base case. A potential bullish scenario would require a breakout above $24.25, suggesting a short-term reversal if momentum shifts, while a break below $23.50 would expose the stock to additional downside risk as weak demand persists.
Previously it was reported that persistent bearish momentum in Comcast stock was unlikely to reverse in the short term despite earnings outperformance and institutional buying. The latest developments confirm ongoing weakness, making it critical for investors to monitor $23.50 as a key support level that could trigger renewed downside risk if breached.


-
 Afghanistan
-
 Albania
-
 Algeria
-
 Angola
-
 Argentina
-
 Armenia
-
 Australia
-
 Austria
-
 Azerbaijan
-
 Bahamas
-
 Bahrain
-
 Bangladesh
-
 Belarus
-
 Belgium
-
 Bolivia
-
 Botswana
-
 Brazil
-
 Brunei
-
 Bulgaria
-
 Cambodia
-
 Cameroon
-
 Canada
-
 Chile
Chile
-
 China
China
-
 Colombia
-
 Congo
Congo
-
 Costa Rica
-
 Cote d'Ivoire
-
 Croatia
-
 Cuba
Cuba
-
 Cyprus
-
 Czechia
-
 DR Congo
-
 Denmark
-
 Dominican Republic
-
 Ecuador
-
 Egypt
Egypt
-
 El Salvador
-
 Estonia
-
 Eswatini
-
 Ethiopia
-
 Finland
-
 France
-
 Georgia
-
 Germany
-
 Ghana
Ghana
-
 Greece
-
 Haiti
Haiti
-
 Hong Kong
-
 Hungary
-
 India
India
-
 Indonesia
-
 Iran, Islamic republic
-
 Iraq
Iraq
-
 Ireland
-
 Israel
-
 Italy
Italy
-
 Jamaica
-
 Japan
Japan
-
 Jordan
-
 Kazakhstan
-
 Kenya
Kenya
-
 Korea
Korea
-
 Kuwait
-
 Kyrgyzstan
-
 Laos
Laos
-
 Latvia
-
 Lebanon
-
 Lesotho
-
 Libya
Libya
-
 Lithuania
-
 Luxembourg
-
 Madagascar
-
 Malaysia
-
 Malta
Malta
-
 Mauritius
-
 Mexico
-
 Moldova
-
 Mongolia
-
 Montenegro
-
 Morocco
-
 Mozambique
-
 Myanmar
-
 Namibia
-
 Nepal
Nepal
-
 Netherlands
-
 New Zealand
-
 Nigeria
-
 North Macedonia
-
 Norway
-
 Oman
Oman
-
 Pakistan
-
 Palestine
-
 Panama
-
 Papua New Guinea
-
 Paraguay
-
 Peru
Peru
-
 Philippines
-
 Poland
-
 Portugal
-
 Puerto Rico
-
 Qatar
Qatar
-
 Reunion
-
 Romania
-
 Rwanda
-
 Saudi Arabia
-
 Serbia
-
 Singapore
-
 Slovakia
-
 Slovenia
-
 Somalia
-
 South Africa
-
 Spain
Spain
-
 Sri Lanka
-
 Sweden
-
 Switzerland
-
 Syria
Syria
-
 Taiwan
-
 Tajikistan
-
 Tanzania
-
 Thailand
-
 Trinidad and Tobago
-
 Tunisia
-
 Turkey
-
 UAE
UAE
-
 Uganda
-
 Ukraine
-
 United Kingdom
-
United States
-
 Uruguay
-
 Uzbekistan
-
 Venezuela
-
 Vietnam
-
 Yemen
Yemen
-
 Zambia
-
 Zimbabwe
- Forex
- Crypto
